
Toggle hotspots to view satellite hotspot locations on the map. Hotspot colors are an indication of how old the spot is.
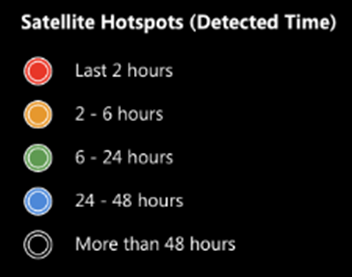
By default, the age of the spot is relative to the current time. Use the realtime/timeline toggle to view hotspots relative to the time on the timeline.
Export to KMZ
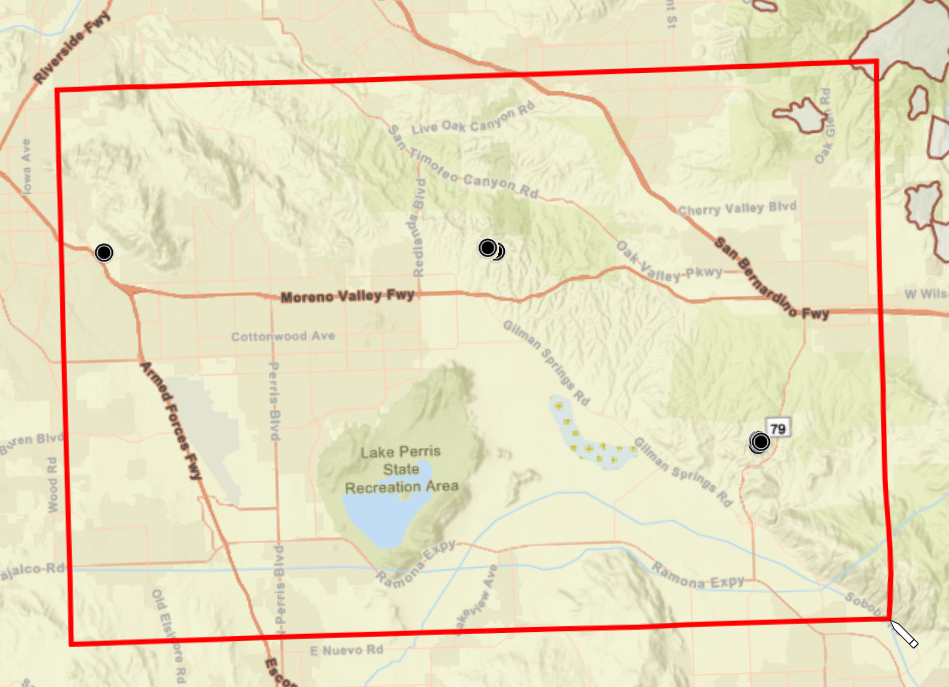
Use the Export to KMZ button to export Hotspots to a KMZ file. The exported KMZ can be used in Google Earth or as fire ignition locations in the FireSim tool. See Running a Test Simulation for more information about using a KMZ as an ignition location.
To export features, click the Export to KMZ button. Your cursor will change into a pencil icon. Click once on the map to begin drawing a rectangle to select features. Double-click to finish the rectangle. Any Hotspot features that intersect with this rectangle will be exported. You will be prompted to save the file.
The fire hot spot layer is provided courtesy of PG&E. The information available through this service is intended only to be used to visualize data. It is not intended to be used as a decision-making tool and PG&E assumes no responsibility for errors or omissions. Under no circumstances should the data be used for reporting fires by the media, public or others, unless provided to media by public safety officials.
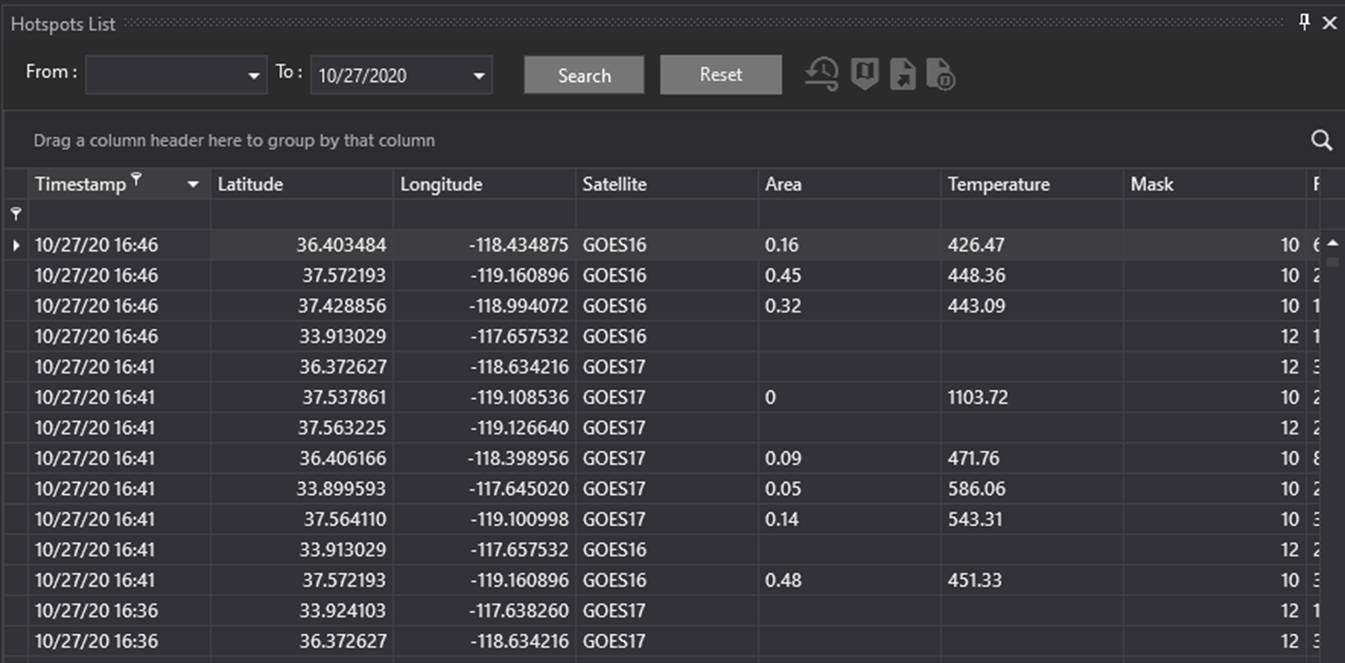
There are six satellite platforms that are combined in this service: GOES-16, GOES-17, MODIS (Aqua, Terra) and VIIIRS (Suomi-NPP, NOAA-20). The data is only provided for CA. PG&E has partnered with the Space Science and Engineering Center to provide a customized data feed of GOES-16 and GOES-17 hot spots for CA. The data is processed only for CA on dedicated servers to limit latency. Polar orbiting hot spot data is collected via public sources.
This platform will not detect all fires as the minimum detectable fire size is dependent on cloud cover, fire intensity, forest canopy and other factors. The satellite information is just one of the many tools that should be used to identify and track incidents. In addition, sometimes the complex algorithms that translate raw satellite images into hot spots will falsely detect hot spots. This typically occurs when the solar angle is “just right” to reflect visible light from large solar installations or when there are hot areas adjacent to cooler areas (more prevalent in deserts and along the coast near sunset). PG&E post-processes the hot spot data to only present the highest confidence data and remove detections from known problem areas such as large solar installations and deserts that do not have contiguous burnable fuel. However, false detections will still occur. We’ve found that a false detection is unlikely if two or more satellites independently detect hot spots in the same area. Therefore, exercise caution when viewing hot spots from only one satellite as there is a higher chance of it being false.
GOES-16 and GOES-17
The GOES-16 and 17 satellites are in a geostationary orbit, meaning they rotate with the earth and always view the same area of earth’s surface. They provide continuous coverage with refreshed images every 5 minutes, at most. The GOES satellites are best used for the rapid detection, as well as tracking an incident over its lifetime.
MODIS and VIIIRS
VIIRS and MODIS are instruments on polar orbiting satellites. They capture higher resolution pictures of the surface, but typically take a snapshot only a few times a day as they pass overhead. The VIIRS and MODIS instruments are more sensitive and have higher resolution than the GOES satellites, so they can detect smaller incidents and provide a more accurate location. However, they do not provide continuous coverage.
MODIS Historical Hotspots
Historical hotspots are available, even if your version of WFA does not have weather data back to that year. This can be useful for historical reanalysis of high-risk events to evaluate where hotspots were observed (by MODIS and VIIRS only, GOES does not have historical hotspots). Can be used with historical weather station observations as manual inputs.