The Timeline is used to cycle through forecasts and view different risk metrics for Assets and Territory at each time interval.
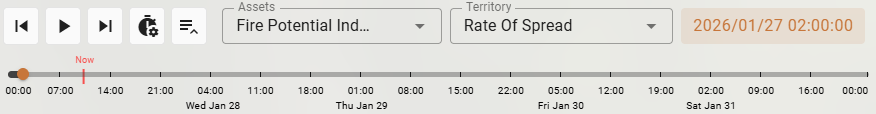
These forecasts are produced daily with a 100 hour horizon. Risk metrics are calculated every one to three hours for the entire forecast period.
All of the risk metrics viewed in Wildfire Operations are related to the time you have selected in the timeline control. As you select different intervals in the forecast, these metrics will update.
Use the Assets dropdown to select the risk metric you would like to view on the map for assets. Use the Territory dropdown to select the risk metric you would like to display for territories. See the Glossary for metric definitions.
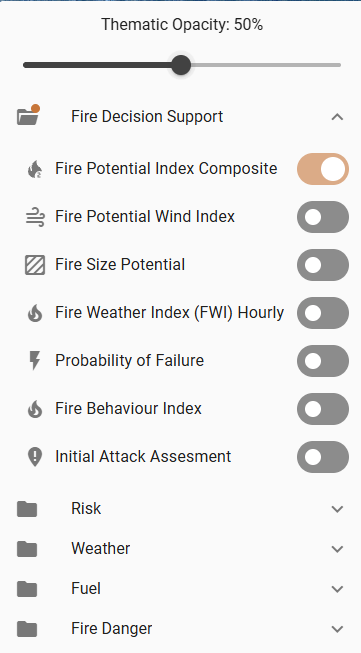
Your risk metrics may look different than the options shown here.
Only one asset or territory metric can be displayed on the map at a time.
Use the Thematic Opacity Slider to adjust the opacity of the risk metric layers based on optimal visibility for the current map view.
Timeline Navigation

Use the Timeline Navigation buttons to: move back one interval, play/pause the forecast, or move forward one interval. Alternatively, click and drag along the timeline to advance or replay the forecast.
Timeline Settings
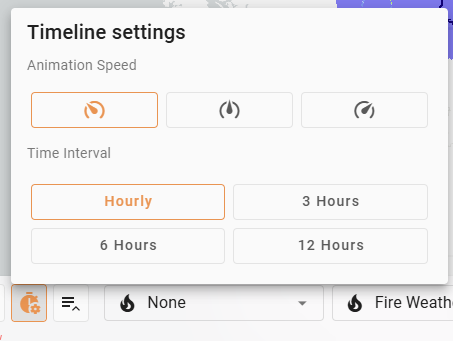
Adjust the Animation Speed of the forecast animation or change the Time Interval on the Timeline.