Logging into Wildfire Operations brings you directly to the main application. Unless default Settings have been changed, the Summary Dashboard will appear.
Screenshots are displayed in Light Mode. Interface will look different if Dark Mode is enabled. Configure settings to change the theme.
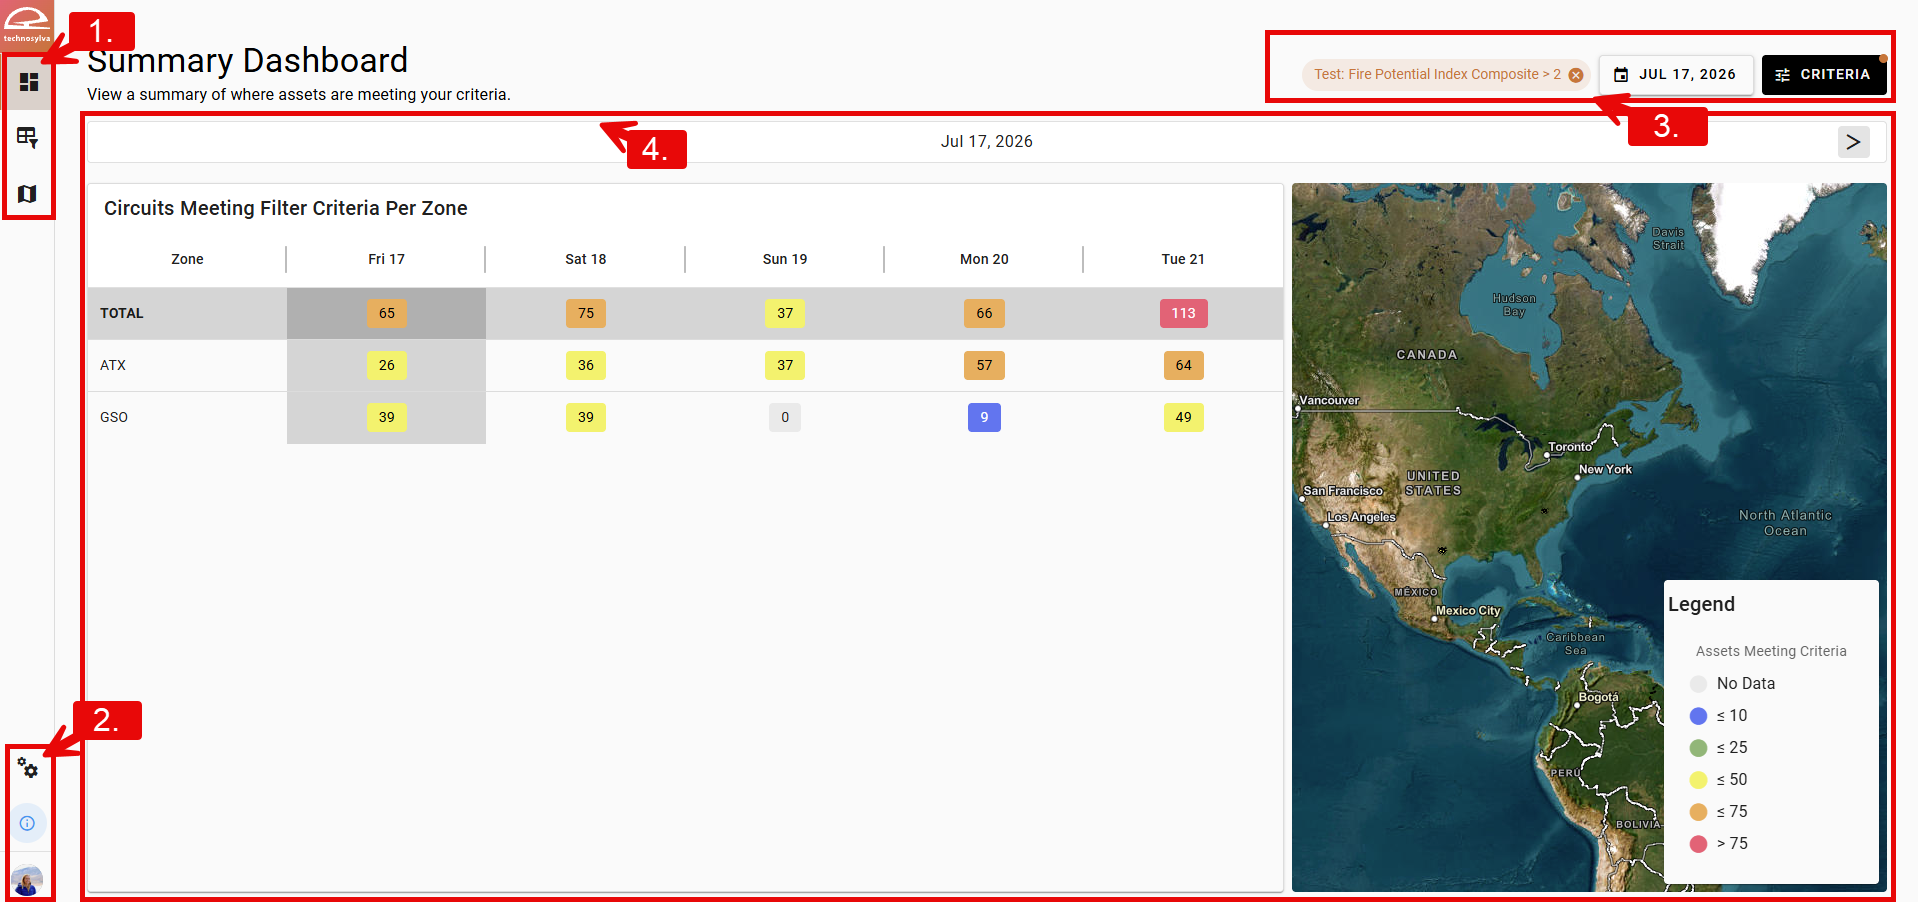
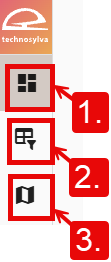
1. Left Panel Navigation Bar
The top Left Panel Navigation Bar provides access to Wildfire Operations' primary pages, updating the content shown in the Page Canvas. To change which page opens on loading, see Settings.
-
Summary Dashboard provides data for the chosen criteria in a summary table format.
-
ForeCast Explorer provides data for the chosen criteria in a timeline format across the forecast.
-
Map displays assets and territories spatially according to user-specified metrics and time.
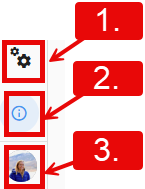
2. Left Panel Settings
The bottom Left Panel navigation bar includes buttons for Settings, Information, and User.
-
Settings configures default preferences
-
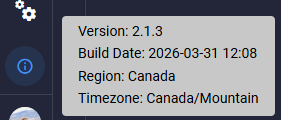
Information displays application Version, Build Date, Region, and Timezone.
-
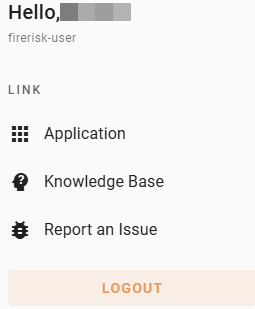
User Icon provides links to:
-
Application: the main application portal
-
Knowledge Base: user documentation
-
Report an Issue: opens service desk
-
Logout
-
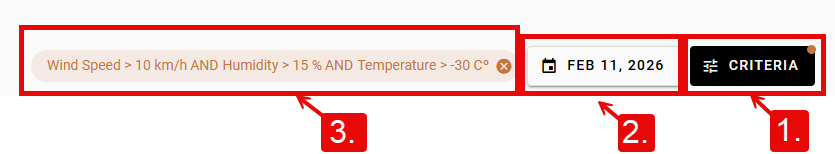
3. Header Bar
The Header Bar is used to configure date and criteria. These options will update the information shown on the Page Canvas.
-
Criteria: apply a saved filter or build a new one.
-
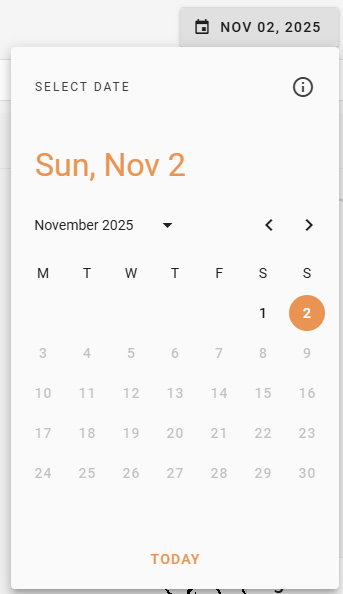
Forecast Selector: select the first day of a forecast. When a past forecast is selected, it shows the forecast days that are available from the selected date. Click Today to jump to the current date.
-
Current Criteria. Not visible if no criteria have been applied.
4. Page Canvas
The content of the Page Canvas is dependent on the selection on the Left Panel Navigation Bar. Depending on what is selected, it will show the Summary Dashboard (Default), ForeCast Explorer, or Map.