Overview
When you're five days or less from a potential event, Wildfire Operations helps you move from monitoring to active assessment. This tutorial guides you through analyzing weather-driven factors, identifying vulnerable assets, modeling event behavior, and translating results into actionable intelligence for decision makers.
What you'll learn:
-
How to evaluate weather conditions and their impact on assets.
-
Methods to identify which assets face the highest threat.
-
Techniques for running and comparing event simulations.
-
Ways to communicate findings to support operational decisions.
Your Wildfire Operations configurations may differ from those shown in this tutorial. For questions about specific capabilities or configurations please contact your Customer Success representative or reach out to our Customer Success Team.
Prerequisites
Before starting this tutorial, ensure you have:
-
Assets and territories configured in your system.
-
Understanding of key weather parameters and fire behavior fundamentals.
-
Organization-wide criteria established based on operational thresholds (Public Safety Power Shutoff (PSPS) criteria for your organization, operational limits, etc.)
Step 1: View Weather and Metrics Across Territory
Understanding the weather forecast and its implications for your territory is the first step in the assessment process. Understanding the forecast allows you to anticipate where problems are most likely to develop and allocate resources accordingly.
Access the Map
-
Navigate to the Map in Wildfire Operations.
-
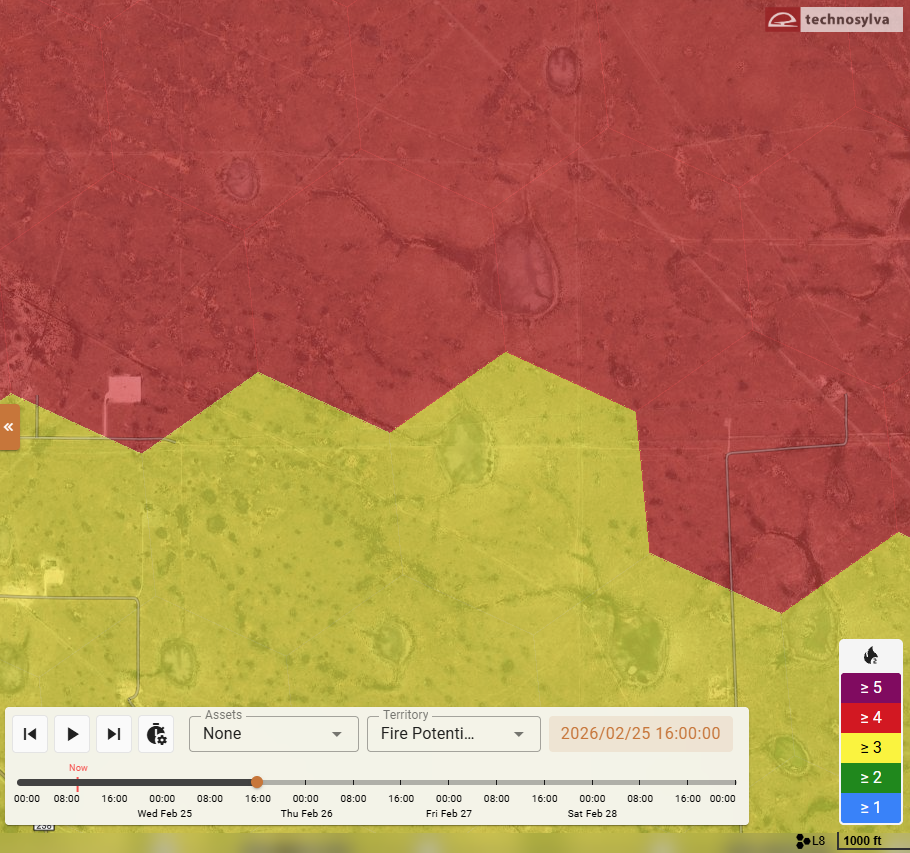
Select a metric from the Territory dropdown.
-
Consider using screenshots to compare different Territory Metrics. Be prepared to consider action plans for situations in which different metrics indicate different levels of severity.
Example: What is your organization’s plan of action when Fire Potential Index Composite (FPIC) is high but Fire Potential Wind Index (FPWI) remains low?
-
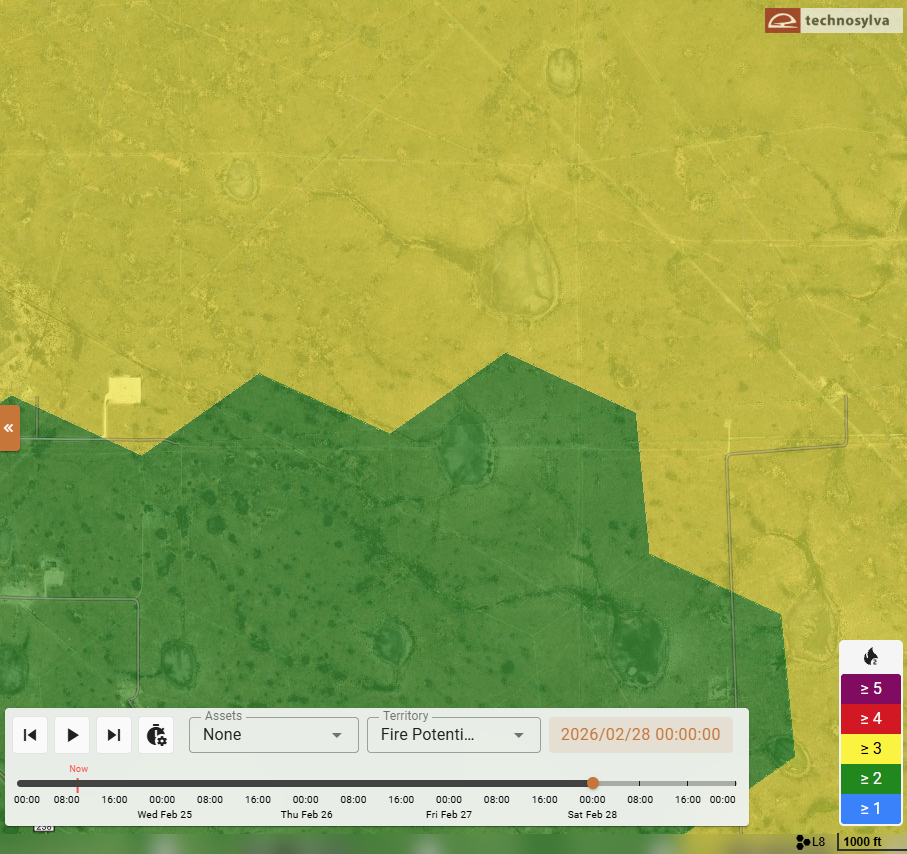
Consider using screenshots to compare the same Territory Metric across different time periods using the Timeline slider below the map.
Example: FPIC peaks at mid-day and is predicted to subside to low-to-moderate levels across within 48 hours.
Step 2: View Weather and Metrics Across Assets
Next, you will examine how weather and risk and danger metrics apply to specific assets within your territory.
Access the Summary Dashboard
-
Navigate to the Summary Dashboard in Wildfire Operations.
-
Use the Criteria Builder to create or apply criteria based on operational thresholds for the event in question (PSPS criteria, ice storm criteria, etc.)
Examples of questions to ask yourself at this stage:
-
What type of event are we looking at?
-
Which criteria do I need to use?
-
What areas do we need to pay attention to?
Defining Criteria
Criteria will focus on conditions that directly influence event behavior and the intersections of these conditions.
One example of a common criteria:
-
30-30-30 Rule: Wind speeds greater than or equal to 30 km/hr AND Humidity less than or equal to 30% AND Temperature greater than or equal to 30°
Criteria can be used to establish various operating procedures for your organization. Some examples include:
-
PSPS Candidates - highlight all circuits that exceed criteria (conditions) for de-energization events.
-
PSPS Approaching - highlight all circuits that approach your PSPS criteria, and potentially change device settings preemptively.
-
Limit Crew Operations - highlight all circuits under high fire risk conditions to limit or suspend crew operations in the field.
Set up organization-wide criteria based on operating thresholds preemptively so you don't have to recreate filters for each event. Ensure criteria match your operational thresholds.
Identify High-Risk Districts and Areas
-
View which districts have assets that meet the expected criteria to further investigate.
-
Cycle through forecast days to identify the highest risk day.
-
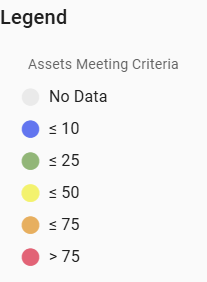
Review the Legend to see the number of assets meeting defined criteria over the next five days.
Apply This Information
As you review weather and risk:
-
Identify geographic areas experiencing the most severe conditions to further investigate in the next step
-
Note timing—when do conditions peak?
-
Consider asset density in high-risk zones
Step 3: Identify At-Risk Assets
With weather context established and high-risk districts identified, narrow your focus to specific assets facing elevated threat.
View At-Risk Assets Across Multiple Views
The Summary Dashboard, Forecast Explorer, and Map views offer different perspectives for examining at-risk assets.
The Forecast Explorer shows a single record for an asset and identifies the first time and the last time within the forecast that it meets the specified Criteria. It identifies:
-
What criteria is met.
-
How many times in the forecast it meets that criteria.
This is distinctly different from the Asset List, which may look similar, but shows the assets that meet criteria for a selected time matching the Map.
-
View risk and weather on the map for your territory as explained in Step 1.
-
Apply filters to display assets in high or extreme risk categories using the criteria you defined in Step 2.
-
View asset list with criteria and map filtered to only show assets meeting criteria.
-
Switch between views to gain different perspectives on the same data.
Evaluate Asset Vulnerability
For each high-risk asset, consider multiple factors. Examples include:
Exposure Factors
-
Proximity to high fuel loads
-
Position relative to terrain features
-
Distance from potential ignition sources
-
Cause of the risk—what's driving the elevated threat?
Consequence Factors
-
Criticality to operations (key circuits, substations, major facilities)
-
Number of customers or communities served
-
Replacement cost and restoration time
-
Access limitations for repair crews
-
Understand the impact to or from that asset
Mitigation Status
-
Recent vegetation management activities
-
Inspection findings and maintenance history
-
Available protective measures
Context Consideration:
-
What other weather information do I need to know for context?
-
Is risk high relative to historical conditions or other benchmarks?
-
Need to be able to quantify risk values (percentiles)
Refine Your Asset List
Use the Asset List to refine your analysis:
-
Refine timeframe of circuits shown—focus on specific days or hours.
-
Refine criteria for specific areas and times within the forecast.
-
View specific asset forecasts for detailed information.
-
Filter out assets that don't meet your specific thresholds.
Create a Priority List
Rank assets based on combined danger and risk metrics. For example:
-
Tier 1 (Immediate Attention): High/extreme fire danger + high consequence
-
Tier 2 (Elevated Monitoring): High fire danger + moderate consequence, or moderate fire danger + high consequence
-
Tier 3 (Standard Protocols): Lower danger or consequence levels
Step 4: Generate and Share Asset Lists
Create actionable lists of impacted assets to share with operational teams who need to take protective actions.
Generate Initial Asset List
-
Navigate to the Map with your applied criteria.
-
Adjust Columns based on event details and intended audience.
-
Export asset lists to CSV for teams without tool access.
Generate Additional Deliverables
Multiple versions of deliverables may be required. Consider adjusting deliverables by geographic area or granularity based on stakeholder type. Examples of deliverables to stakeholders may include:
For Field Operations
-
Asset priority list
-
Fire behavior summary
-
Time-critical assets
-
Access considerations
For Executive Leadership
-
Risk overview: number of assets in each risk category
-
Potential impacts: estimated customers affected, restoration time, operational consequences
-
Resource requirements
-
Decision Triggers: conditions that would escalate response level
Step 5 - Run Simulations
Fire spread modeling helps you understand potential fire behavior if ignition occurs near critical assets. Fire spread simulations transform abstract risk into concrete spatial and temporal predictions. You can see which assets are in the fire's path, estimate when they'll be threatened, and determine whether you have time to implement protective measures or need to pre-position resources.
Set Up Your Simulation
-
Navigate to Simulations in the Map view
-
Select a simulation starting point:
-
Choose locations near high-priority assets
-
Consider likely ignition sources
-
Focus on areas with adverse wind/fuel combinations
-
-
Run the simulation and review the output.
-
Note spread patterns.
-
Consider asset impacts.
-
Step 6 - Compare Simulations
Running multiple scenarios reveals how changing conditions affect outcomes and helps you prepare for various possibilities. Real-world conditions never match predictions exactly. Comparing multiple scenarios builds situational awareness and helps you prepare flexible response plans. You'll understand which assets are vulnerable regardless of specific conditions versus which require scenario-dependent responses.
Create Comparison Scenarios
Run additional simulations with different parameters. For example:
Weather Parameter Variations
-
Simulate fires with different weather scenarios (e.g. best-case and worst-case wind conditions)
-
Run simulations comparing Forecast weather to Constant inputs
Ignition Location Variations
-
Simulate fires starting from different high-risk ignition points
-
Consider multiple simultaneous ignitions if widespread activity is possible
Time of Day Variations
-
Midday conditions: Peak burning conditions (high temp, low humidity, strong winds)
-
Evening/night: Moderated conditions (lower temp, higher humidity, calmer winds)
Analyze Differences
Display simulations side-by-side and compare key metrics. For example:
-
Which assets are threatened in all scenarios vs. only worst-case?
-
How much does timing to impact vary?
Identify Decision Points
Identify decision points based on your analysis. For example, you may want to identify:
-
Consistent threats: Assets endangered across all scenarios need immediate protective action
-
Conditional threats: Assets only threatened in some scenarios require contingency planning. Develop "if/then" protocols: "If winds exceed X mph, implement plan for asset Y"
-
Timing triggers: Establish decision points: "If fire behavior reaches X intensity by time Y, execute plan Z". Account for lead time needed to deploy resources
Document Scenario Analysis
Create a summary for decision makers. For example:
-
Likely scenario: Most probable outcome based on forecast
-
Best case: Minimum expected impacts
-
Worst case: Maximum credible threat
-
Recommended actions: Prioritized list based on scenario analysis
Best Practices
Update Regularly
-
Reassess conditions regularly.
-
Re-run simulations if weather forecasts change significantly.
-
Update asset priorities as situations evolve.
Maintain Perspective
-
Models predict potential behavior under specified conditions.
-
Actual event behavior may vary due to localized factors.
-
Use simulations to inform decisions, not dictate them.