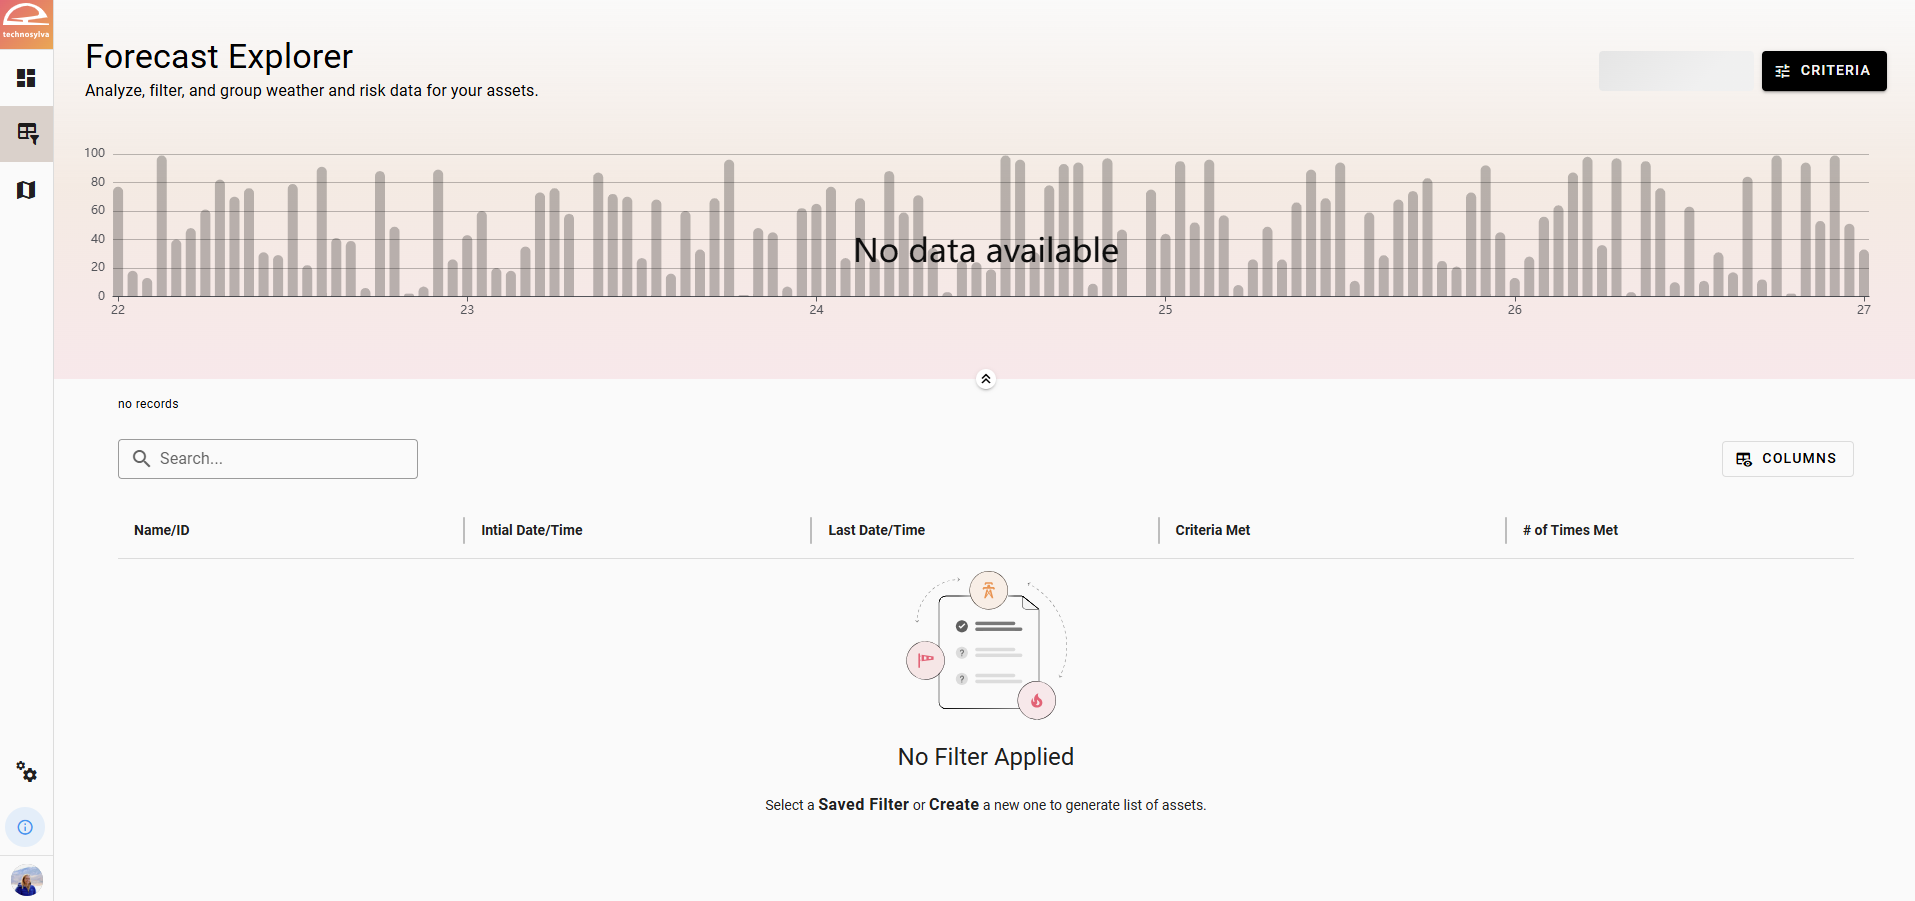
The Forecast Explorer tool allows you to analyze, filter, and group weather and risk data for your assets meeting any criteria specified using the Criteria button. If no criteria have been specified yet, the Forecast Explorer will be empty.
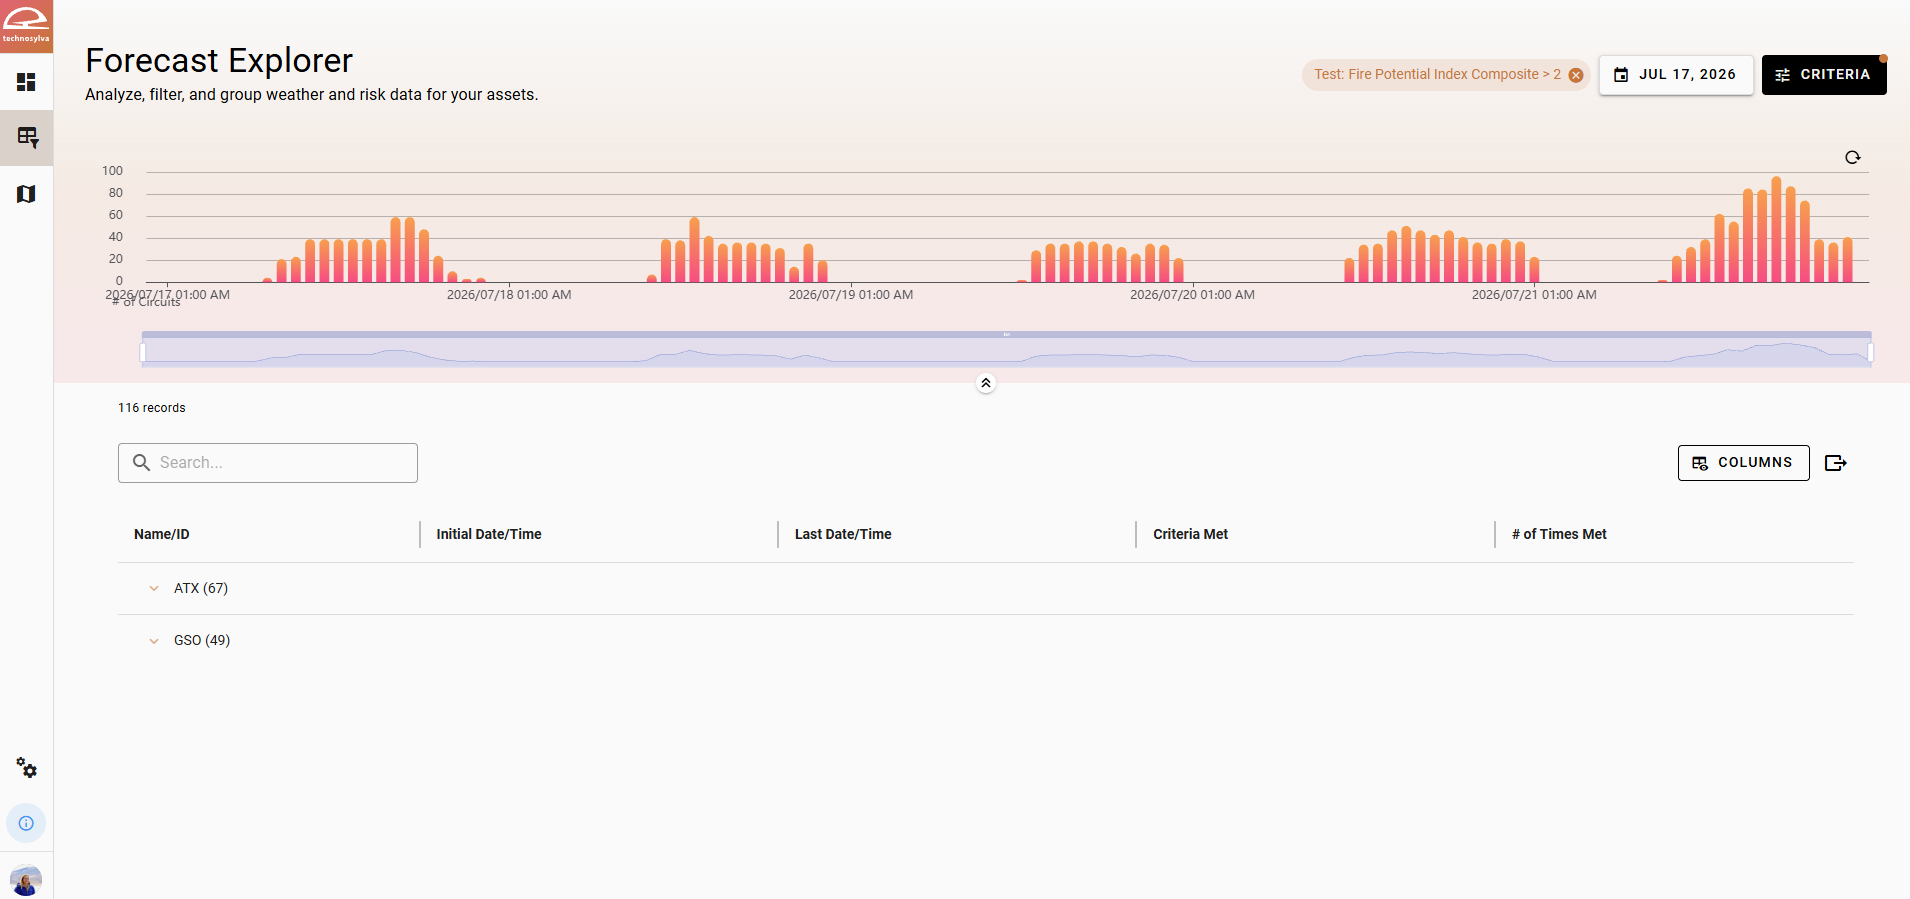
Once criteria have been applied, the Forecast Explorer will update to show those assets which meet the selected criteria for the active forecast.
Review Criteria Results
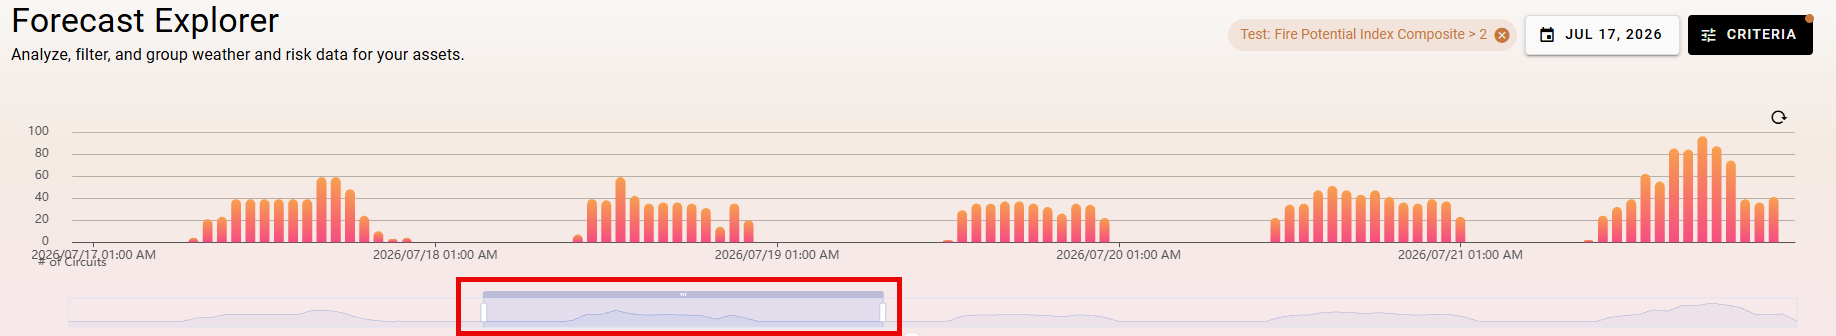
A timeline loads at the top of the list to show how many assets for each of your areas meet the defined criteria at every interval throughout the forecast period. Drag the slider beneath the timeline to focus on the assets meeting the defined criteria withing a specific time frame.
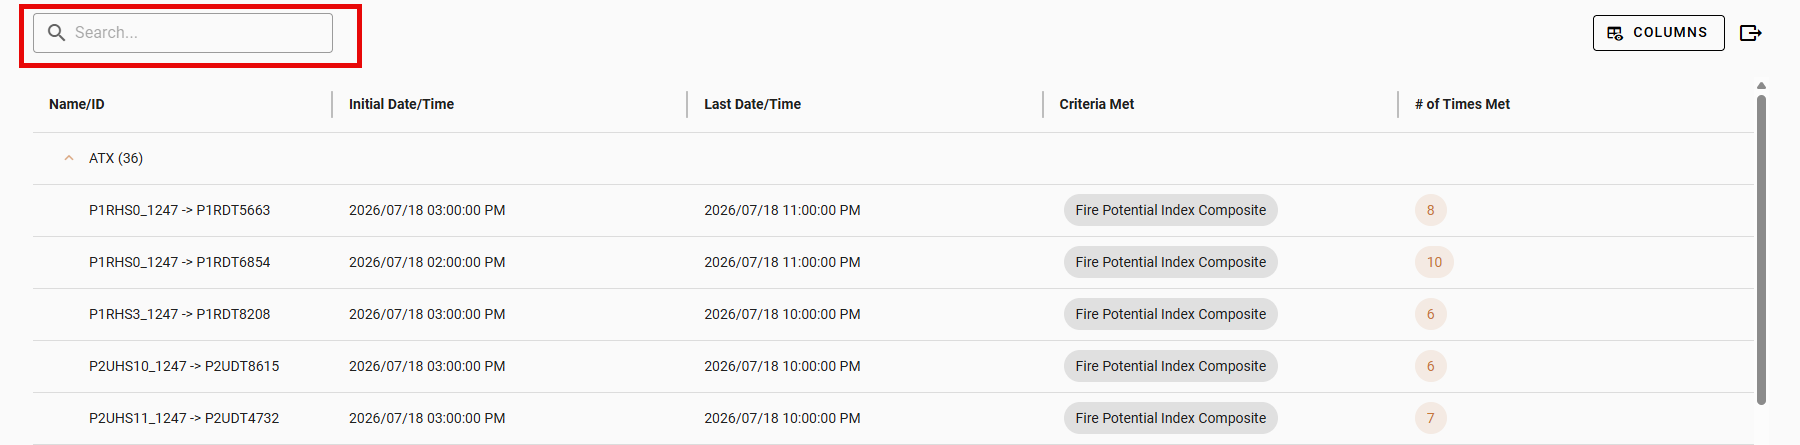
From here you can click through the filtered assets in the table below or search for an asset by name to view the asset details and zoom into the asset locations. Expand the dropdown under each area to view the specific assets.
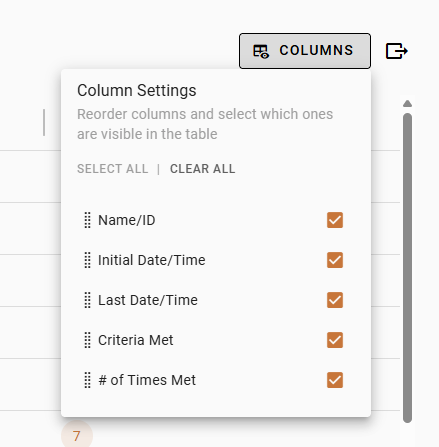
Use the Columns button in the top right of the table to adjust the columns you would like to remain visible or reorder columns.
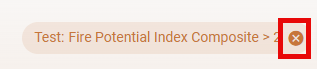
Use the X button in the top right of any criteria to clear the criteria and start again.
Click an asset name to view forecast and child assets for that asset.
Use the Export button in the top right of the asset table to export the results as a .csv.

The Forecast Explorer shows a single record for an asset and identifies the first time and the last time within the forecast that it meets the specified Criteria. It identifies:
-
What criteria is met.
-
How many times in the forecast it meets that criteria.
This is distinctly different from the Asset List, which may look similar, but shows the assets that meet criteria for a selected time matching the Map.