Active Wildfires and Current Fire Perimeters
Click an Active Wildfire on the map to see more information about an active fire incident including type, size, status, case, and responsible area.
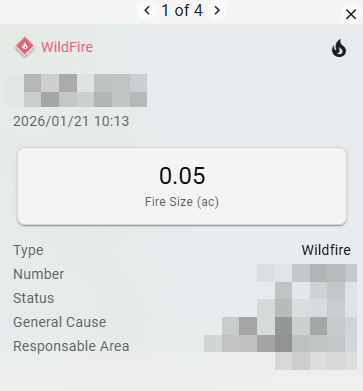
For US customers, active fire data comes from Integrated Reporting of Wildland Fire Information (IRWIN).
Air Quality Index (AQI)
Click an Air Quality Index (AQI) point on the map to see the information being provided.
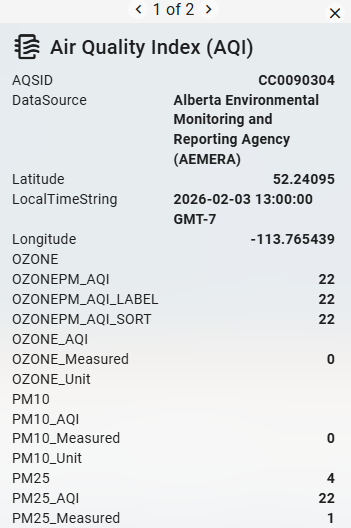
The AQI layer displays official particulate matter (PM) monitoring sites across the map. PM is the primary component of wildfire smoke and is classified by particle size. PM2.5 — particles 2.5 micrometers or smaller in diameter — are fine enough to penetrate deep into the respiratory system, making them the most significant public health concern during active wildfire events.
Each monitoring site icon displays a color and index number corresponding to the AQI levels defined in the map legend. Click any icon to open a pop-up with site-specific details, including the timestamp and particle size of measured pollutants. Most sites refresh hourly.
AQI data is provided by AirNow.
Cameras Layer
Live cameras offer added situational awareness by providing visibility throughout the service territory. When the layer is toggled on, click the camera icons for pop-up window that shows the latest image from that location.
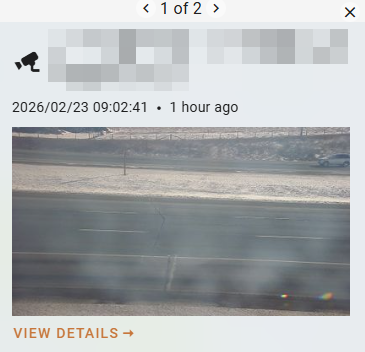
Camera footage comes from ALERTCalifornia and Windy.
For more information on how to use cameras effectively before and during an event, see the In-Event Support tutorial.
FireGuard
Fireguard uses military satellites with the National Interagency Fire Center, U.S. Forest Service, and the National Geospatial-Intelligence Agency’s Firefly capability to detect wildfires, notify authorities, and create products for firefighting networks nationwide. When toggled on, the Fireguard fire perimeters display on the map and are color-coded by age, from 2 hours to over 48 hours old. This data updates daily in Wildfire Operations.
Fuel Model and Fuel Burn Scars
See the Fuels Glossary for more information on Technosylva’s fuels models.
MODIS 48hrs
The MODIS 48hrs layer displays thermal activity detected over the past 48 hours by the MODIS sensors aboard NASA's Aqua and Terra satellites. This data enables users to visualize and assess active wildfire locations worldwide at a 1 km spatial resolution. Click any red dot icon to view satellite-detected details for that location. Note that MODIS detects all significant heat sources, including volcanoes and gas flares, not only wildfires.
Data comes from the MODIS - Thermal Detection, Last 48 Hours dataset.
VIIRS Hotspots
The VIIRS 48hrs layer provides an additional source of satellite-detected thermal activity to complement MODIS data. The Visible Infrared Imaging Radiometer Suite (VIIRS), aboard the Suomi NPP and NOAA-20 satellites, detects thermal hotspots — including wildfires, volcanoes, and gas flares — at a 375 m spatial resolution. This finer resolution gives VIIRS an advantage over MODIS in detecting smaller fires that might otherwise go unregistered.
When the layer is active, dots populate the map and fade over time as detections age. Click any icon to view a pop-up with satellite-detected details for that hotspot.
Data comes from the VIIRS - Thermal Hotspots and Fire Activity dataset.
Weather Stations
Real-time weather data is available when the weather stations layer is toggled on. Arrow icons will appear on the map, symbolizing the latest wind direction data at that location.
Click a weather station on the map and then click See More to see all weather parameters.
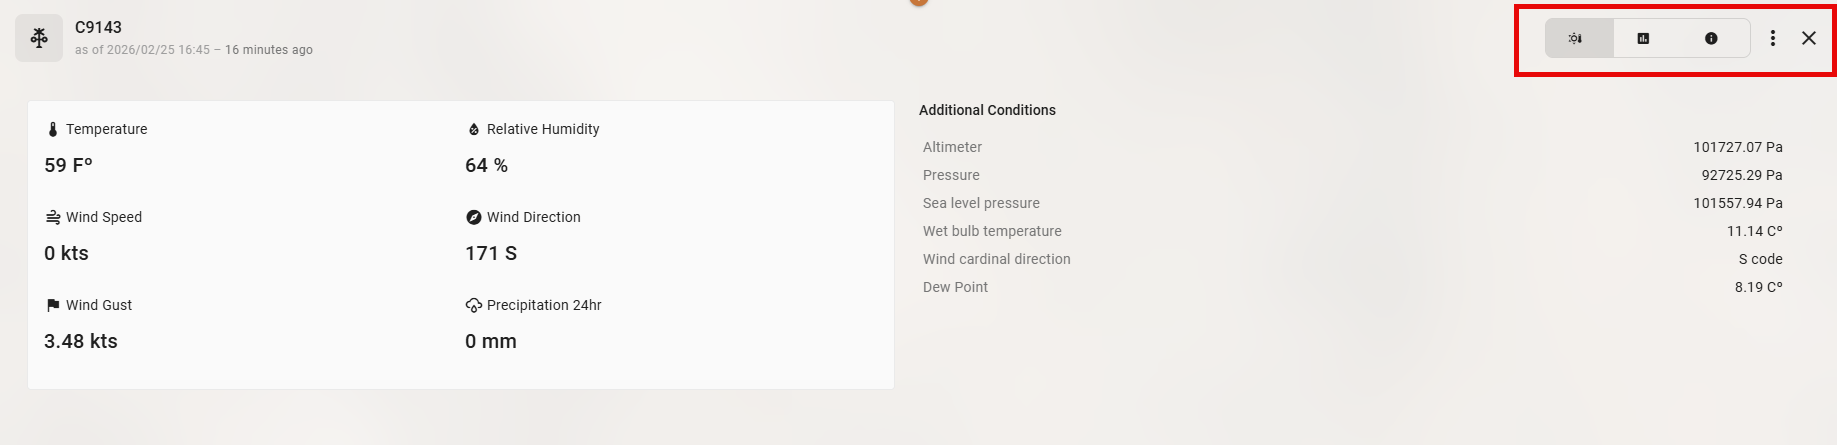
By default, the Info panel appears. Toggle through the panels in the top right to view the weather station data as a Chart over time or to get more information About the station.
Click the three dot icon in the top right to Zoom to Station on the map.
Synoptic provides the weather station data. Weather station networks available through Synoptic include ASOS, RAWS, PG&E, SCE, and SDG&E, and most weather stations update at 15-minute intervals. Details on all available networks and providers are listed here.