The Map page provides geospatial visualization of asset and territory metrics across the timeline. This page provides access to the Asset List (for viewing assets that meet the defined Criteria across the forecast) and Simulations (fire spread predictions).
Asset List
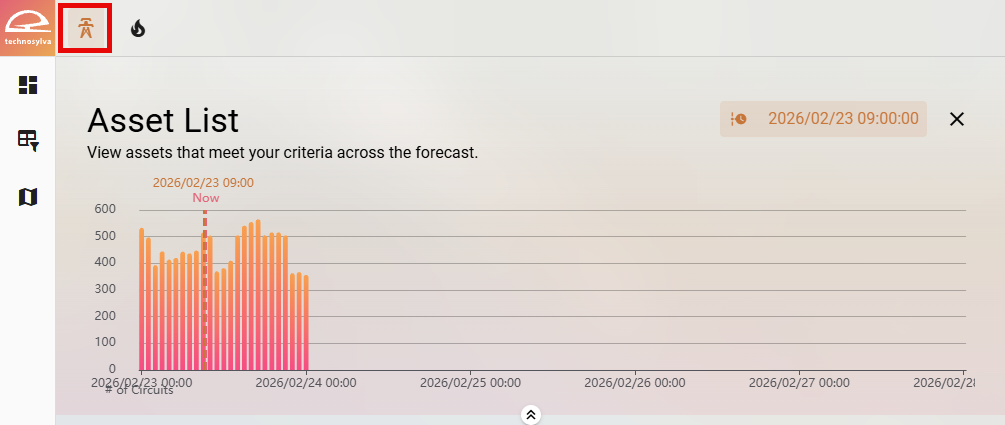
Select the Asset List panel from the top left of the Map view to view assets that meet your applied criteria across the forecast.
Simulations
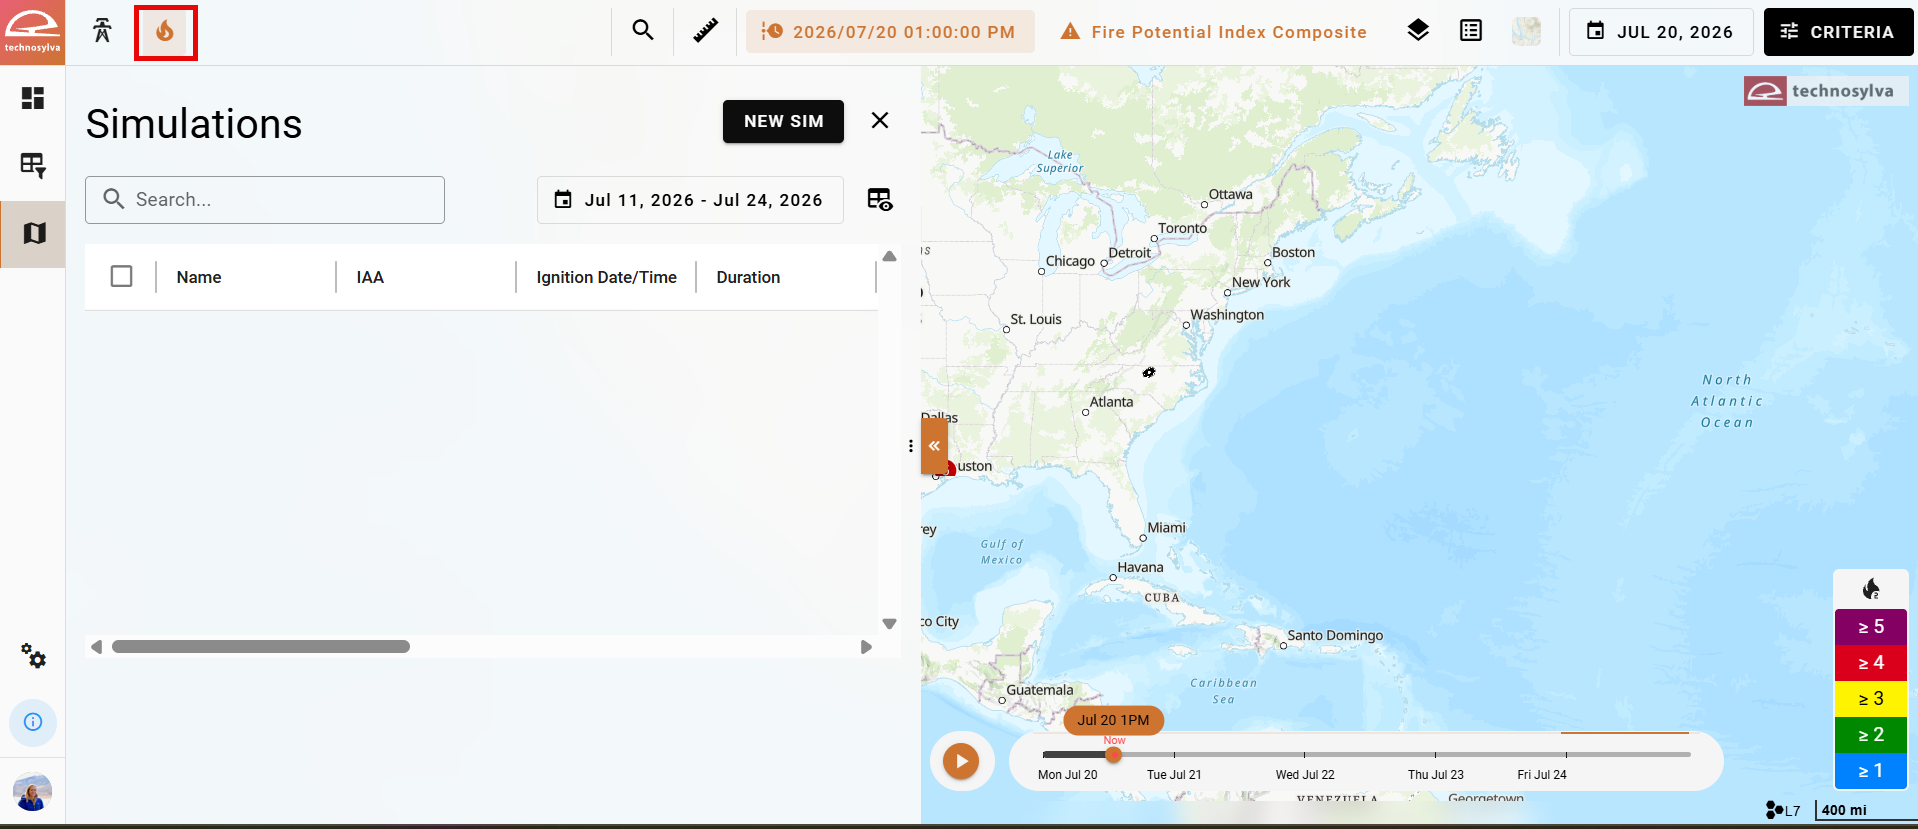
To run or view a simulation (a fire spread prediction), select the Simulations panel from the top left of the map view.
Map Tools
Search
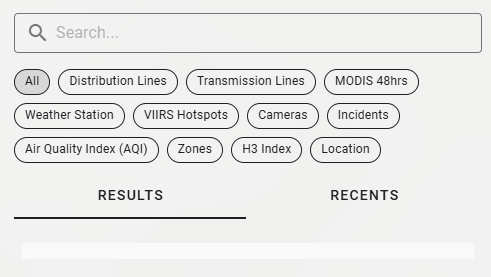
The Search tool allows you to select from a list of pre-populated search options, or type a new query. Navigate to the Recents tab to view recent searches.
Weather Stations Settings
The Weather Stations toolbar icon is only visible when Weather Stations are turned on in the Reference Layer Selector.
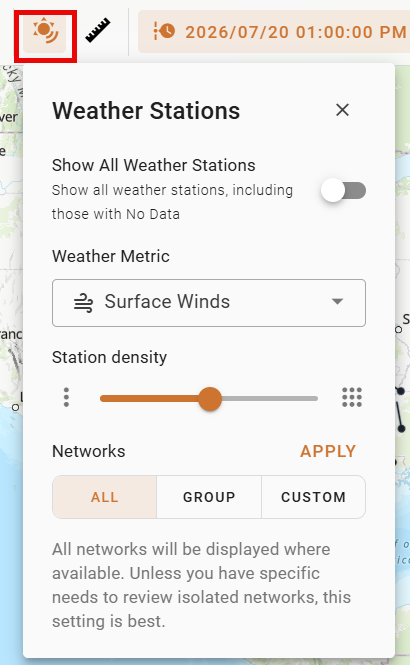
Click the Weather Stations button on the toolbar to adjust settings related to Weather Station visibility and metrics.
-
Use the Show All Weather Stations toggle to turn on and off visibility of stations with no data.
-
Use the Weather Metric dropdown to select a weather metric. This updates the visible metric on the map.
-
Use the Station Density slider to adjust the visibility of weather stations on the map based on the need for legibility at the current scale.
-
Use the Networks section to select all weather station networks (default), select a predefined group from the Group dropdown, or select a custom network from the Custom dropdown. Click Apply to see the chosen stations on the map.
Learn more about Weather Station data.
Measure
The Measure tool gives you the ability to quickly measure distance on the map.

-
Click the ruler icon on the Map Tools toolbar to activate the measure tool.
-
Click on the map to add a point and begin measuring.
-
Double-click to complete the measurement.
The distance will be displayed on the map. To change the desired units, visit Settings.
The measurement will remain on the map until you click the X button on the Map Tools toolbar.
Timeline
The Timeline can be toggled on and off from the Map Tools toolbar:

This tool is used for visualizing Asset and Territory Metrics across the forecast.
Risk & Weather Layers Dropdown
The Risk & Weather Layers Dropdown is used to select the metric for visualizing Asset and Territory Metrics . The toolbar will read No active metric until a metric is selected from the dropdown, at which point the name of the selected metric will appear.


Reference Layer Selector
Configured layers will depend on your organization, and will not match the example shown here.
The Reference Layer Selector is used to determine what data should be shown on the map. Click the checkbox on the right to turn a layer on or off. Click the droplet symbol to adjust the transparency of the layer.
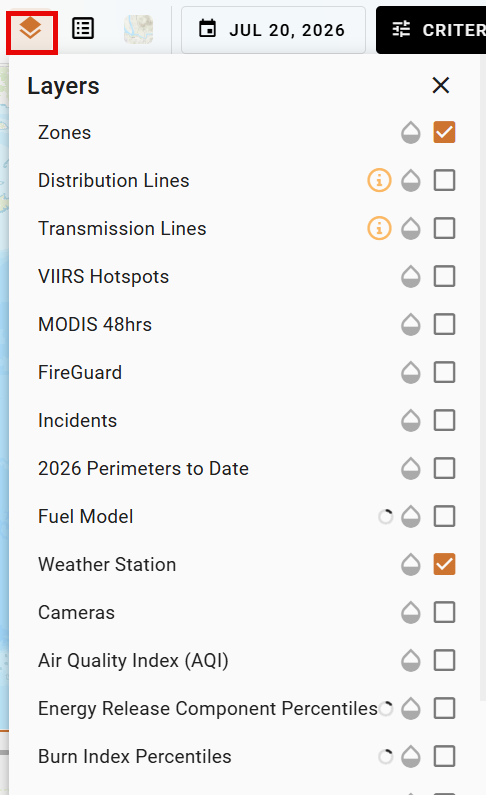
For more information about data points in the layers shown on the map, click the data point. A pop-up will appear with different information depending on the type of layer.
Where multiple layers overlap, you may need to scroll through the pop-ups using the bar at the top of the pop-up window to get the pop-up for the desired layer.

See Map Reference Layers: Definitions and Sources for more information about individual layers.
Legend Toggle

Turn the Map Legend on or off. The map legend defines what each color, symbol, and icon on the map represents. Toggling the legend allows users to balance map readability with the level of interpretive reference needed at any given moment.
-
Enable when interpreting unfamiliar data layers or onboarding new users.
-
Disable during active operational use. When layer meanings are already well understood, hiding the legend frees up screen space, keeping the map display as unobstructed as possible.
Basemap Selector
Choose a basemap from the dropdown.
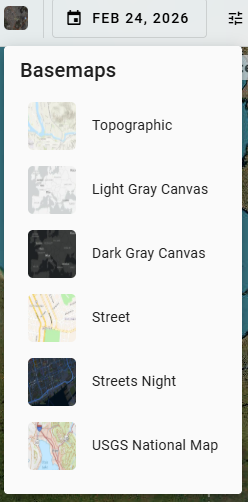
The choice of basemap depends on what information you need to prioritize at a given moment. A basemap that works well for terrain analysis may obscure critical data layers, while one optimized for layer visibility may strip away the geographic context needed for situational awareness — selecting the right basemap ensures the map display supports the decision at hand. Options of basemaps and the use case for each include:
-
Topographic — Best for terrain-focused analysis, providing elevation contours and landform detail that help contextualize fire behavior and spread potential across varied landscapes.
-
Light Gray Canvas — A clean, neutral background that reduces visual clutter and lets data layers stand out clearly.
-
Dark Gray Canvas — Similar to Light Gray but optimized for low-light environments or night operations, reducing screen glare while maintaining layer visibility.
-
Street — Useful when infrastructure context matters, such as identifying evacuation routes, access roads, or proximity of fire activity to populated areas.
-
Streets Night — The same street-level detail as Street, but with a darker palette suited for nighttime operations or extended monitoring sessions.
-
USGS National Map — Best for detailed geographic reference, incorporating USGS data on land cover, hydrography, and boundaries — useful for broader situational awareness and resource planning.