
The Map provides an interactive, spatially detailed view of the outage forecast alongside weather forecast layers, transmission infrastructure, and real-time weather station data.
To access the Map, select the Map icon from the left navigation bar.
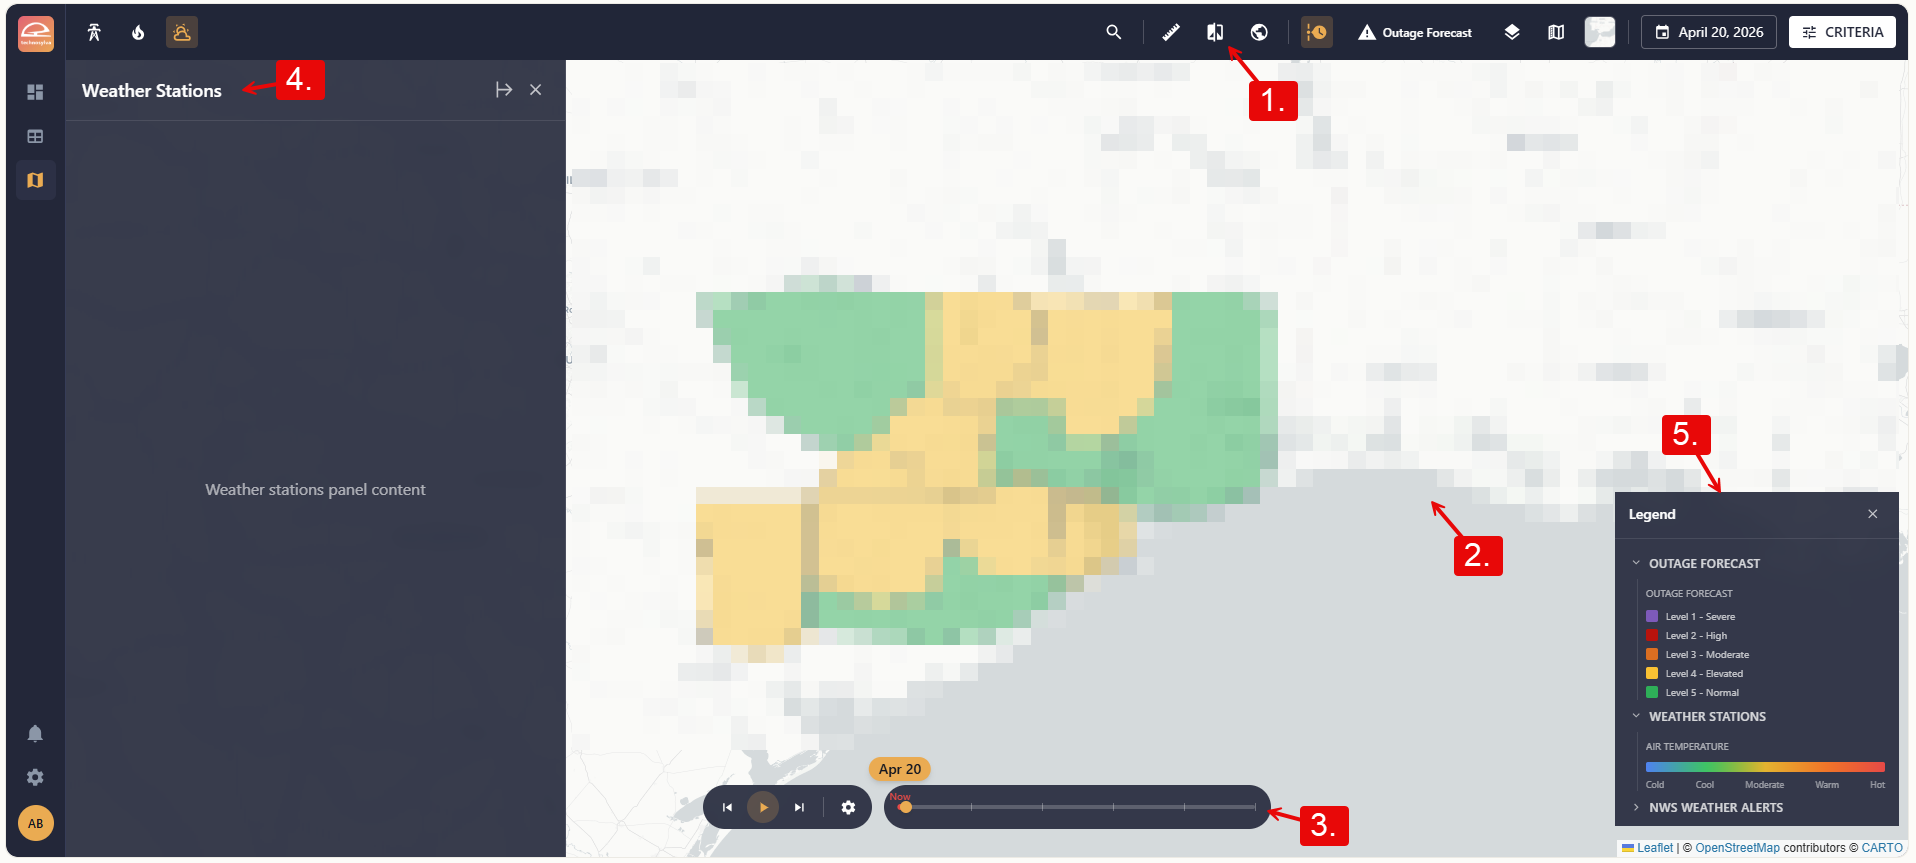
1. Top Navigation Bar
The top navigation bar provides access to the Map's primary controls.
-
Search: Search for a specific location or asset within your territory.
-
Measure: Activate the distance measurement tool.
-
Tabs (Explore / Compare): Switch between single-layer exploration and side-by-side layer comparison.
-
Zoom to Full Extent: Zoom’s to the full extent of your territory.
-
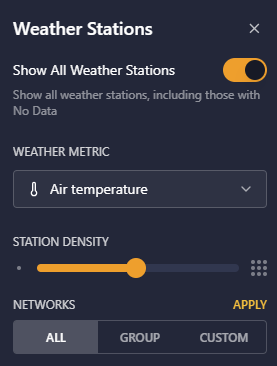
Weather Stations: Use the Show All Weather Stations toggle to set visibility of weather stations with no data. Use the Weather Metric dropdown to select what weather metric is displayed over weather stations on the map. The Station Density slide adjusts density for optimal viewing purposes. Use the Networks option to select or create custom groups of stations.
-
Timeline: Toggle the timeline control on or off.
-
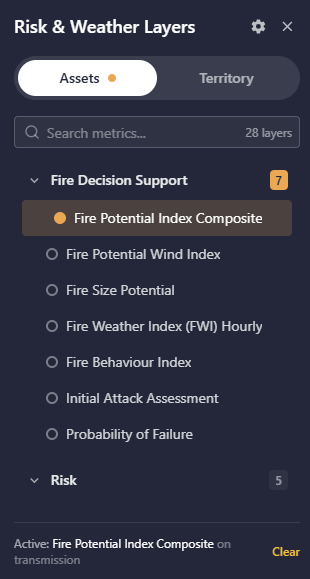
Risk and Weather Layers: Click the ! icon with the name of the active layer, if any, displayed to right. Toggle between the Assets and Territory tabs to select a asset or territory level metric to display on the map. Available metrics are organized by group. Use the Search bar to search available metrics or click Clear to start over.
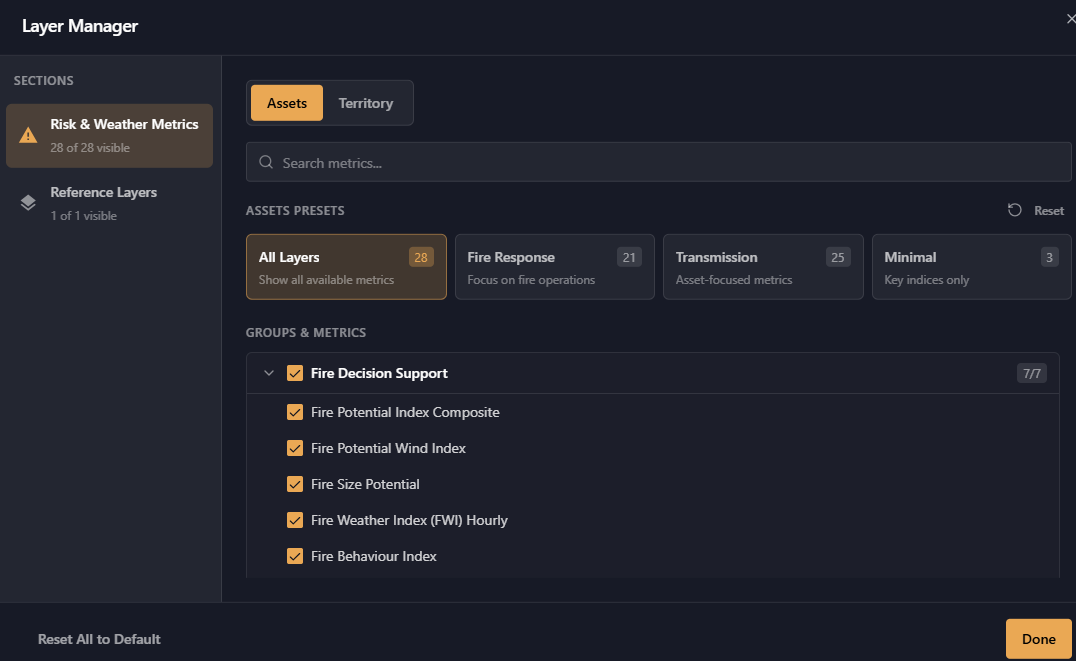
To change the available metrics and reference layers, click the Settings icon in the top right to open the Layer Manager. Toggle between the Assets and Territory tabs to manage the available presets for risk and weather metrics. Or, click the Reference Layers under Sections to manage the available presets for reference layers. Make the desired changes and click Save Preset to implement the new presets or Reset to start over. Click Reset All to Default to restore the original presets. Click Done to finalize changes.
-
Reference Layers: Control which reference layers are displayed on the map.
-
Legend: Toggle the map legend on or off.
-
Basemap: Select the base map style (Imagery Hybrid, Light Grey Canvas, Dark Grey Canvas, Streets, or Terrain).
-
Forecast: The date displayed in the upper-right controls which forecast run is shown across all views. To change the forecast date, select the date field and choose a date from the calendar.
-
Criteria: adjust the thresholds and display settings that govern how the forecast is visualized across the Dashboard and Map. Criteria settings are persistent across your session.
2. Map Canvas
The central map display is interactive.
-
Select a service center to open the District Detail Panel or click a transmission line or weather station to see a pop-up with more information.
-
Use the mouse wheel to zoom in and out.
-
Click and drag to pan.
3. Timeline Control
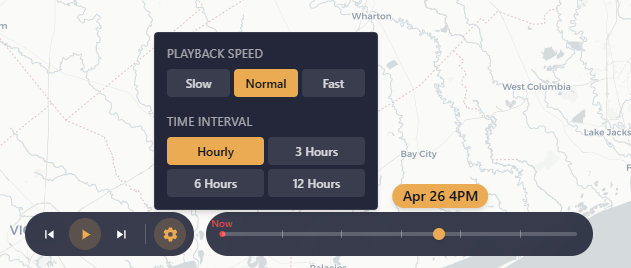
The timeline control appears at the bottom of the map and steps through the forecast period. Select the Timeline button in the top navigation bar to show or hide it.
Press Play to progress through the timeline automatically or use the Forward and Back buttons to jump through intervals. Or, drag the handle to control the timeline manually.
When Outage Forecast is the active metric, the timeline operates in daily mode, displaying one day at a time across the five-day forecast window. The map and legend update to reflect the selected day.
For all other forecast metrics and weather variables, the timeline steps in one-hour increments.
4. Left Panel
Select Transmission Lines, Fire Simulations, or Weather Stations from the top navigation bar to open the left panel in the corresponding view.
5. Map Legend
The legend shows the color scale for the active layer and the corresponding value ranges. Select the Legend button in the top navigation bar to show or hide it.