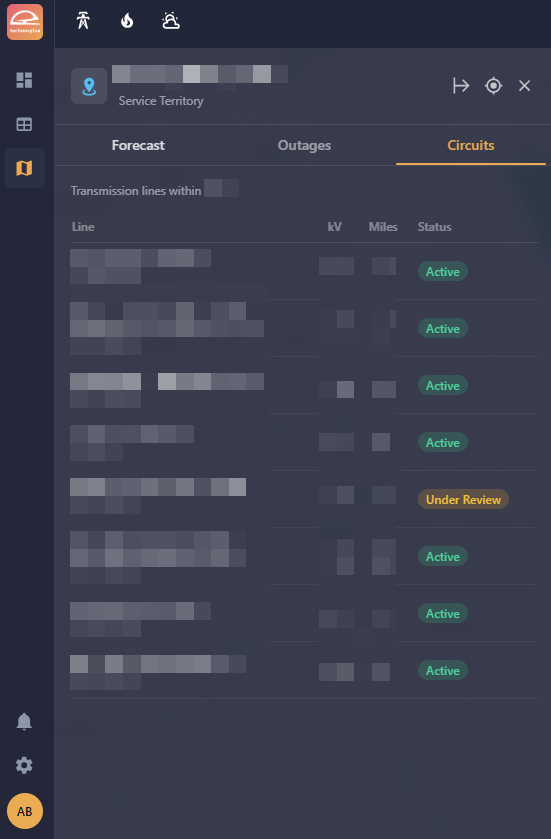
The District Detail Panel provides a district-level breakdown of the outage forecast, weather forecast, and circuit inventory. It opens when you select a service center on the Map or select a row in the Dashboard district table.
1. Header
The panel header displays the district name and its parent territory designation.
-
Select the Expand icon to widen the panel for a larger view of the forecast charts.
-
Use the Zoom to Feature button to center the map on the selected service center's boundaries.
-
Click X to close the panel.

2. Forecast Tab
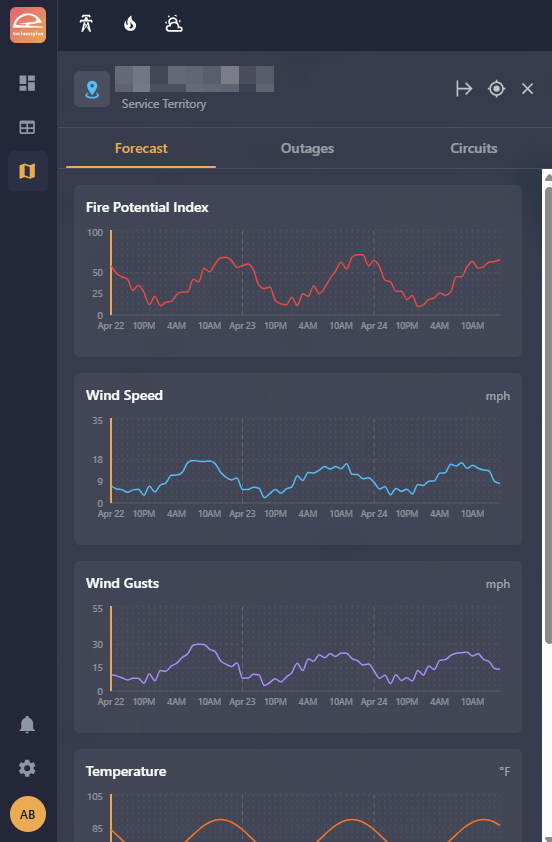
The Forecast tab shows the weather forecast for the selected district across the five-day window. Forecast variables are displayed as hourly time series. Use the timeline to scrub through forecast hours.
3. Outages Tab
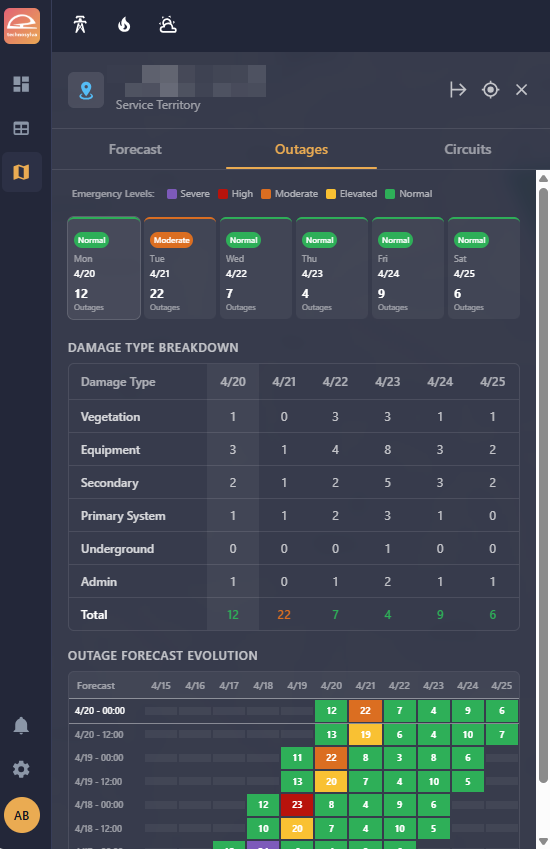
The Outages tab shows the outage forecast for the selected service center broken down by day.
Predict Plus and Restore tiers: Each day also shows the predicted outage count broken down by damage category.
Restore tier: The required crew count to meet your target restoration timeline is displayed alongside the damage category breakdown for each day.
4. Circuits Tab
The Circuits tab lists the transmission lines that run through the selected district with kV, Miles, and Status.