The Timeline is used to cycle through forecasts and view different risk metrics for Assets and Territory at each time interval.
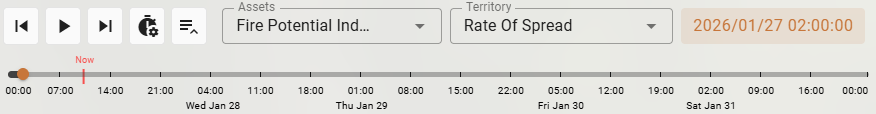
These forecasts are produced daily with a 100 hour horizon. Risk metrics are calculated every one to three hours for the entire forecast period.
All of the risk metrics viewed in Wildfire Operations are related to the time you have selected in the timeline control. As you select different intervals in the forecast, these metrics will update.
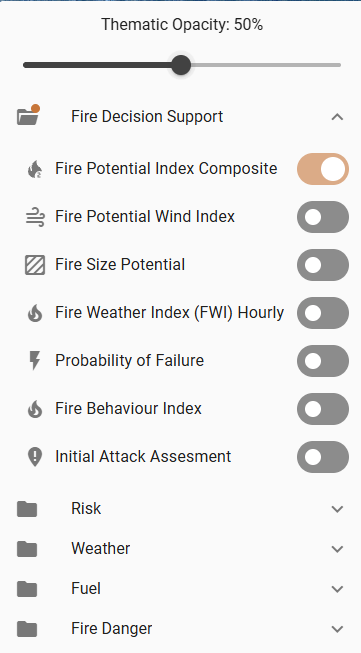
Use the Assets dropdown to select the risk metric you would like to view on the map for assets. Use the Territory dropdown to select the risk metric you would like to display for territories. See the Glossary for metric definitions.
Your risk metrics may look different than the options shown here.
Only one asset or territory metric can be displayed on the map at a time.
Use the Thematic Opacity Slider to adjust the opacity of the risk metric layers based on optimal visibility for the current map view.
Territory-Wide Risk
Territory-wide risk gives you an aggregated view of wildfire conditions across your entire service area, helping you quickly understand where elevated risk is concentrated and how it is distributed across the landscape. Rather than evaluating assets or circuits individually, this view lets you assess the overall threat environment before drilling into specific locations.
The impact analysis for a single fire spread prediction is calculated for a regular grid of ignition points across the project area (approximately 1000m grid spacing). This provides continuous coverage across the territory. For each daily 100-hour weather forecast, the risk outputs are calculated for each ignition point every 3 hours, consistent with asset risk. The user may choose whether to display the result in the output’s raw units (e.g., acres for fire-size potential).
H3 Hexagonal Grid
Territory-wide risk is displayed using an H3 hexagonal grid (a geospatial indexing system that divides the earth's surface into equal-area hexagons). Wildfire Operations uses H3 hexagons to aggregate and visualize risk across your territory for several reasons:
-
Uniform area representation. Unlike square grid cells or administrative boundaries, H3 hexagons have consistent shape and area across the map. This means a high-risk hex in one part of your territory represents the same geographic footprint as a high-risk hex in another, making visual comparison meaningful.
-
No directional bias. Hexagons distribute adjacency evenly in six directions rather than four, which reduces the distortion that square grids introduce when modeling phenomena like fire spread, which moves in response to wind and terrain rather than along cardinal axes.
-
Scalable resolution. H3 supports multiple resolution levels. Wildfire Operations uses a resolution appropriate for territory-level situational awareness: each hexagon covers a meaningful geographic area so that the risk map remains legible at the scale of a full service territory without requiring you to zoom into individual assets.
-
Aggregated risk scoring. Each hexagon aggregates the conditions present within its footprint into a single risk score. This gives operators a fast, scannable overview.
Asset Risk
Asset risk refers to the fire risk metrics calculated for individual assets based on ignition points located along each asset. To calculate risk for each asset, Wildfire Operations simulates fire spread predictions using the asset location as the source of ignition. Asset risk metrics are calculated for asset-based ignition locations at a maximum distance of every 100m along overhead distribution and transmission lines.
Each night, a new weather forecast is generated and used to run fire spread predictions from each ignition point at each time step in the forecast, using a three-hour interval. Every ignition point has an associated spread prediction with impacts calculated based on the extent of the predicted fire spread.
Ignition points are not placed directly on the asset segment itself. Because GIS asset data is not always spatially precise in absolute terms, a buffer of ignition points is created around each segment to reflect the range of plausible ignition locations associated with a failure of that segment. This buffered approach also accounts for ignitions that occur near (but not directly beneath) an asset, which is the more realistic scenario under windy conditions where sparks can be carried some distance from the point of failure.
A standard eight-hour duration (representing a first burning period) is used for each prediction. Once the final impact values are calculated, the maximum value of an ignition point within 100m of the segment is assigned back to the individual distribution and transmission line segments.
Timeline Settings
Use the Timeline Navigation buttons to: move back one interval, play/pause the forecast, or move forward one interval. Alternatively, click and drag along the timeline to advance or replay the forecast.

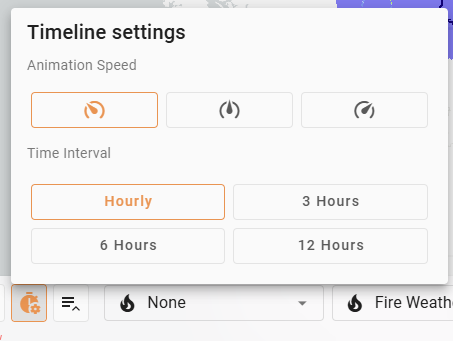
Adjust the Animation Speed of the forecast animation or change the Time Interval on the Timeline.