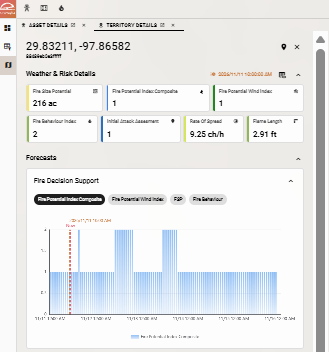
Clicking anywhere in your territory opens the Territory Details panel. Clicking on a zone or asset opens the Asset Details panel. You can have a Territory Details panel and an Asset Details panel open at the same time. Click a tab to switch between the two, or click Open in a separate window on either tab.

Territory Details
Click a location on the map to open the Territory Details panel. The panel shows forecast weather and risk values for that location.
The panel header shows the coordinates of the selected location and its cell ID.
-
Click Go To Extent (pin icon) to center the map on the location.
-
Click Close (x icon) to close the panel.
Weather and Risk Details
This section shows metric values for the selected location at the forecast time shown in orange in the section header. Each card shows one metric.
Use the Select Metrics button in the top-right corner to select or reorder the metric panels to display under Weather & Risk Details. At least one metric must be enabled.
For metric definitions, see the Technosylva Glossary.
Forecasts
The Forecasts section charts metric values over the forecast period for Fire Decision Support, Risk, Weather, Fuel, and Fire Danger. Select a metric above the chart to display it. The red Now line marks the current time.
Asset Details
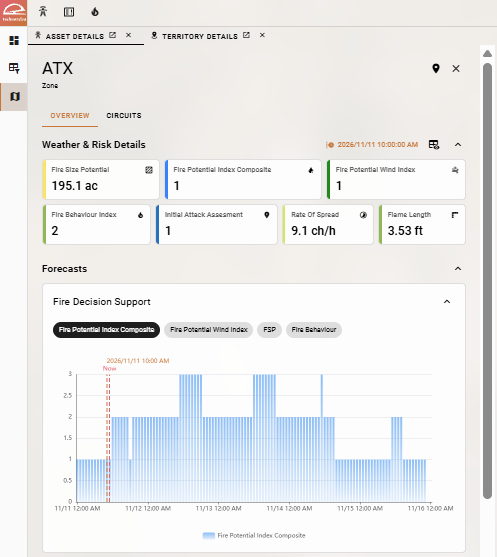
Click a zone or asset anywhere in Operations to open its Asset Details panel. The panel shows the asset’s forecast and subcomponents (child assets).
Depending on your organization, you may see other terminology for zones, assets, and child assets. The functionality remains the same.
The panel header shows the name and asset type of the selected asset.
-
Click Go To Extent (pin icon) to center the map on the asset.
-
Click Close (x icon) to close the panel.
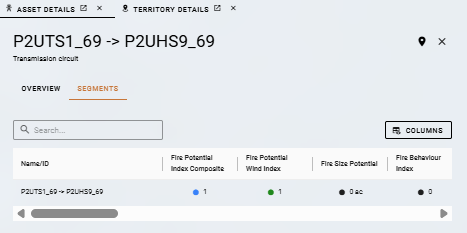
Use the Overview / Subcomponents (e.g. Circuits) tabs to switch between an Overview of the zone or asset and a Subcomponents table with information about the subcomponents of that asset for the specific hour of the forecast selected in the timeline. For example, circuits may appear as subcomponents of a zone, or segments as subcomponents of a circuit.
Overview Tab
Asset Weather and Risk Details and Forecasts appear the same as for Territory Details (as previously described).
Subcomponents Tab
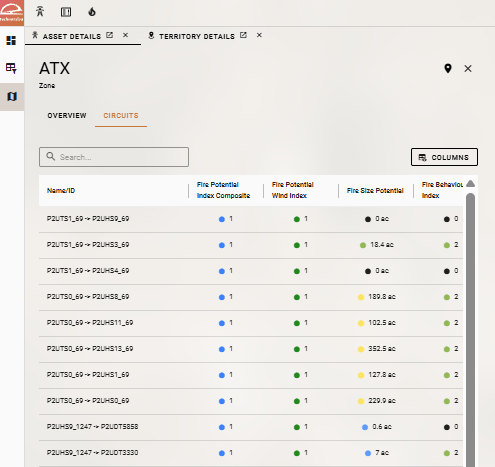
The Subcomponents tab lists the subcomponents of the asset with their forecast metric values. In this example, the subcomponents are circuits in a zone.
-
For line assets, each row shows the start and end points of the subcomponent.
-
Each metric column shows the value for the selected forecast time. The colored dot shows the value’s class, using the same colors as the map legend for that metric.
-
Enter a name or ID in Search to filter the list.
-
Click Columns to choose which metric columns appear and change their order.
Click a subcomponent to open its own Asset Details panel. In this example, the asset is a circuit and the subcomponent (child asset) is a segment.