-
Select a Dataset from the dropdown to begin a New Request.
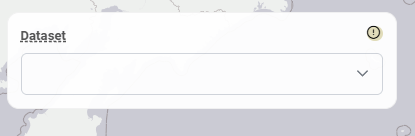
If a field requires attention before you can submit, it will display a yellow warning indicator.
Each dataset corresponds to a specific weather model, geographic region, and time period. When you select a dataset, the map zooms automatically to show its domain extent, and the available variables and date range update accordingly.
Dataset names include a domain identifier: D01, D02, or D03, corresponding to the outermost to innermost domain. D03 has the highest spatial resolution.
If multiple datasets cover your area of interest, choose the one whose domain, time period, and variables best match your needs.
When you select a dataset, the map zooms to show its geographic domain.
-
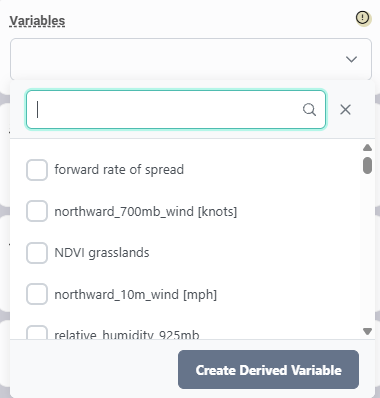
After selecting a dataset, choose one or more Variables from the dropdown. You can search by name or scroll through the list. All variables in a single query must share the same temporal resolution (hourly or daily). Most variables are hourly by default. Examples of daily-only variables include Live Fuel Moisture (LFM), NDVI, and KBDI. If an hourly variable is selected, daily variables will be greyed out, and vice-versa.
Available variables vary by customer. For more information about variables, see the Technosylva Glossary.
-
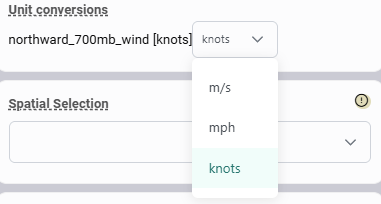
To change a variable's output units (where applicable), use the unit selector that appears alongside it after selection. Available conversions depend on the variable.
-
Click Derived Variable to create a new variable by applying a function to one or more existing variables in the selected dataset.
-
Define your area of interest using the Spatial Selection dropdown. The available options are:
-
Entire Domain — retrieves data across the full extent of the dataset. This is the most computationally expensive option. All selected regions must fall within the domain extent of the chosen dataset.
-
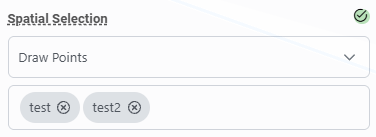
Draw Points/Draw Polygons — draw one or more points or polygons directly on the map, or click to place individual points. Each shape or point must have a label. To delete a shape that you drew on the map, click the x next to the label name.
-
Upload CSV file with Points — choose a CSV file to upload.
-
Use Saved Point Groups — select from saved point location sets. Point groups are managed under the Point Groups tab and must be uploaded there before they appear here.
-
Use Uploaded Shapefiles — select from pre-uploaded shapefiles associated with the chosen dataset. Shapefiles are managed under the Shapefiles tab and must be uploaded there before they appear here.
-
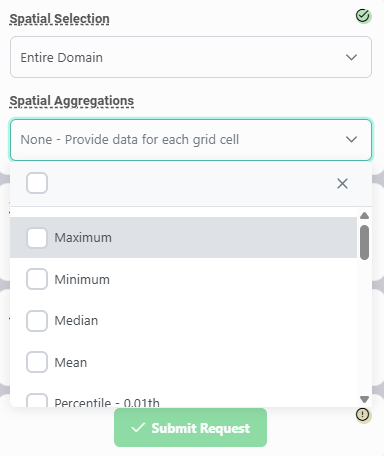
When using polygons or the entire domain, you can optionally aggregate values across the selected region using the Spatial Aggregations dropdown that appears. Available aggregations are: Minimum, Maximum, Median, Mean, and percentiles (1st, 5th, 10th, 25th, 75th, 90th, 95th, 99th). If no spatial statistics are selected, the query returns raw values at each grid cell. When spatial statistics are applied, output is limited to CSV.
-
Temporal Parameters set the time range, resolution, and any aggregation method.
-
Select the desired Output Format. Available formats depend on your region selection and whether spatial statistics are applied:
-
CSV — always available; required when spatial statistics are applied or when using point locations.
-
KMZ — available for polygon and full-domain queries without spatial statistics; viewable in Google Earth.
-
NetCDF — available for polygon and full-domain queries without spatial statistics; viewable in tools such as NCView.
-
GeoTIFF — available for polygon and full-domain queries without spatial statistics.
-
Fill out the Request Description. This information helps you find this request from Previous Requests later.
-
Select the request Priority (Low, Medium, or High).
-
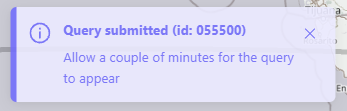
Click Submit Request. A pop-up appears indicating the request was submitted successfully. Switch to the Previous Requests tab to monitor progress.