Logging into Wildfire Planning brings you directly to the main application.
Wildfire Planning is both map-centric and asset-centric. The Map Canvas remains visible regardless of the tools in use, while the Asset Table provides an overview of all assets in your service territory.
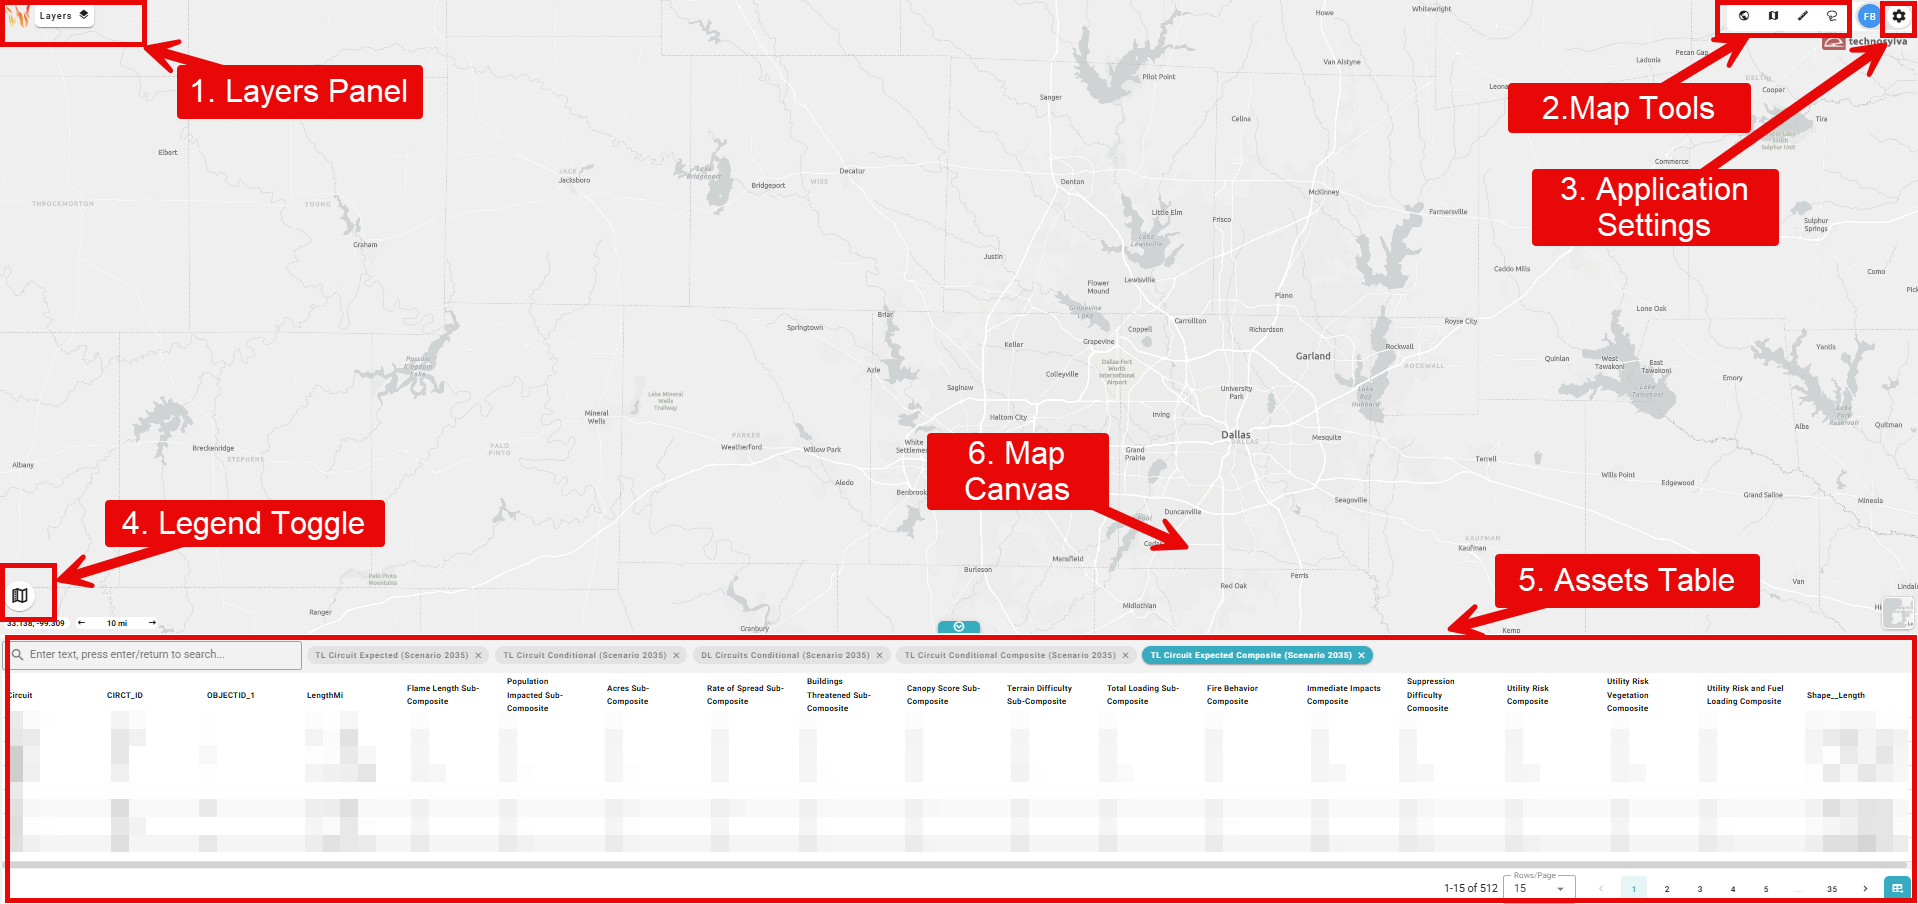
1. Map Layers Panel
The Map Layers panel is where you will manage, select, and view all of the available reference layers in Wildfire Planning.
2. Map Tools
The Map Tools panel allows you to control and interact with the map through Zoom, Sync, Measure, and Lasso tools.
3. Application Settings
The Application Settings provide user-specific customizations such as Dark Mode that adjust the look and feel of the Wildfire Planning application.
4. Legend Toggle
Use the Legend Toggle to turn the Map Legend on and off.
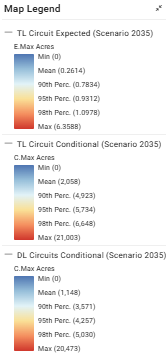
The content in the Map Legend is controlled by the selections in the Map Layers panel.
5. Assets Table
The Assets Table displays asset-specific information in separate tabs for each layer selected in the Map Layers panel.
6. Map Canvas
The Map Canvas is always visible in Wildfire Operations. The content in the Map Canvas is controlled by the selections in the Map Layers panel.
Basemap Selector
Use the Basemap Selector in the bottom right corner of the Map Canvas to change the basemap.
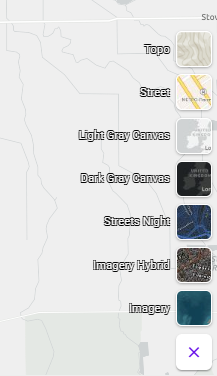
The choice of basemap depends on what information you need to prioritize at a given moment. A basemap that works well for terrain analysis may obscure critical data layers, while one optimized for layer visibility may strip away the geographic context needed for situational awareness — selecting the right basemap ensures the map display supports the decision at hand. Options of basemaps and the use case for each include:
-
Topographic — Best for terrain-focused analysis, providing elevation contours and landform detail that help contextualize fire behavior and spread potential across varied landscapes.
-
Street — Useful when infrastructure context matters, such as identifying evacuation routes, access roads, or proximity of fire activity to populated areas.
-
Light Gray Canvas — A clean, neutral background that reduces visual clutter and lets data layers stand out clearly.
-
Dark Gray Canvas — Similar to Light Gray but optimized for low-light environments or night operations, reducing screen glare while maintaining layer visibility.
-
Streets Night — The same street-level detail as Street, but with a darker palette suited for nighttime operations or extended monitoring sessions.
-
Imagery Hybrid — Satellite imagery with street/label overlay. Ideal to see actual tree canopy, land cover, and terrain while still reading place names and roads.
-
Imagery — Satellite imagery ideal for detailed fuel and vegetation analysis where you want an unobstructed view of ground cover.