
This tutorial walks through a complete query from start to finish. As an example, we will retrieve hourly surface wind gust data for a utility service territory on the day of the Palisades fire (January 7, 2025) to examine how conditions evolved as the fire spread.
The same steps apply to any query you run in Data Manager.
Step 1: Decide on a Dataset
After logging in, you will see the New Request form with a map of North America.
Open the Dataset dropdown and review the available options. Each dataset name includes a domain identifier (D01, D02, or D03) where D03 is the highest resolution.
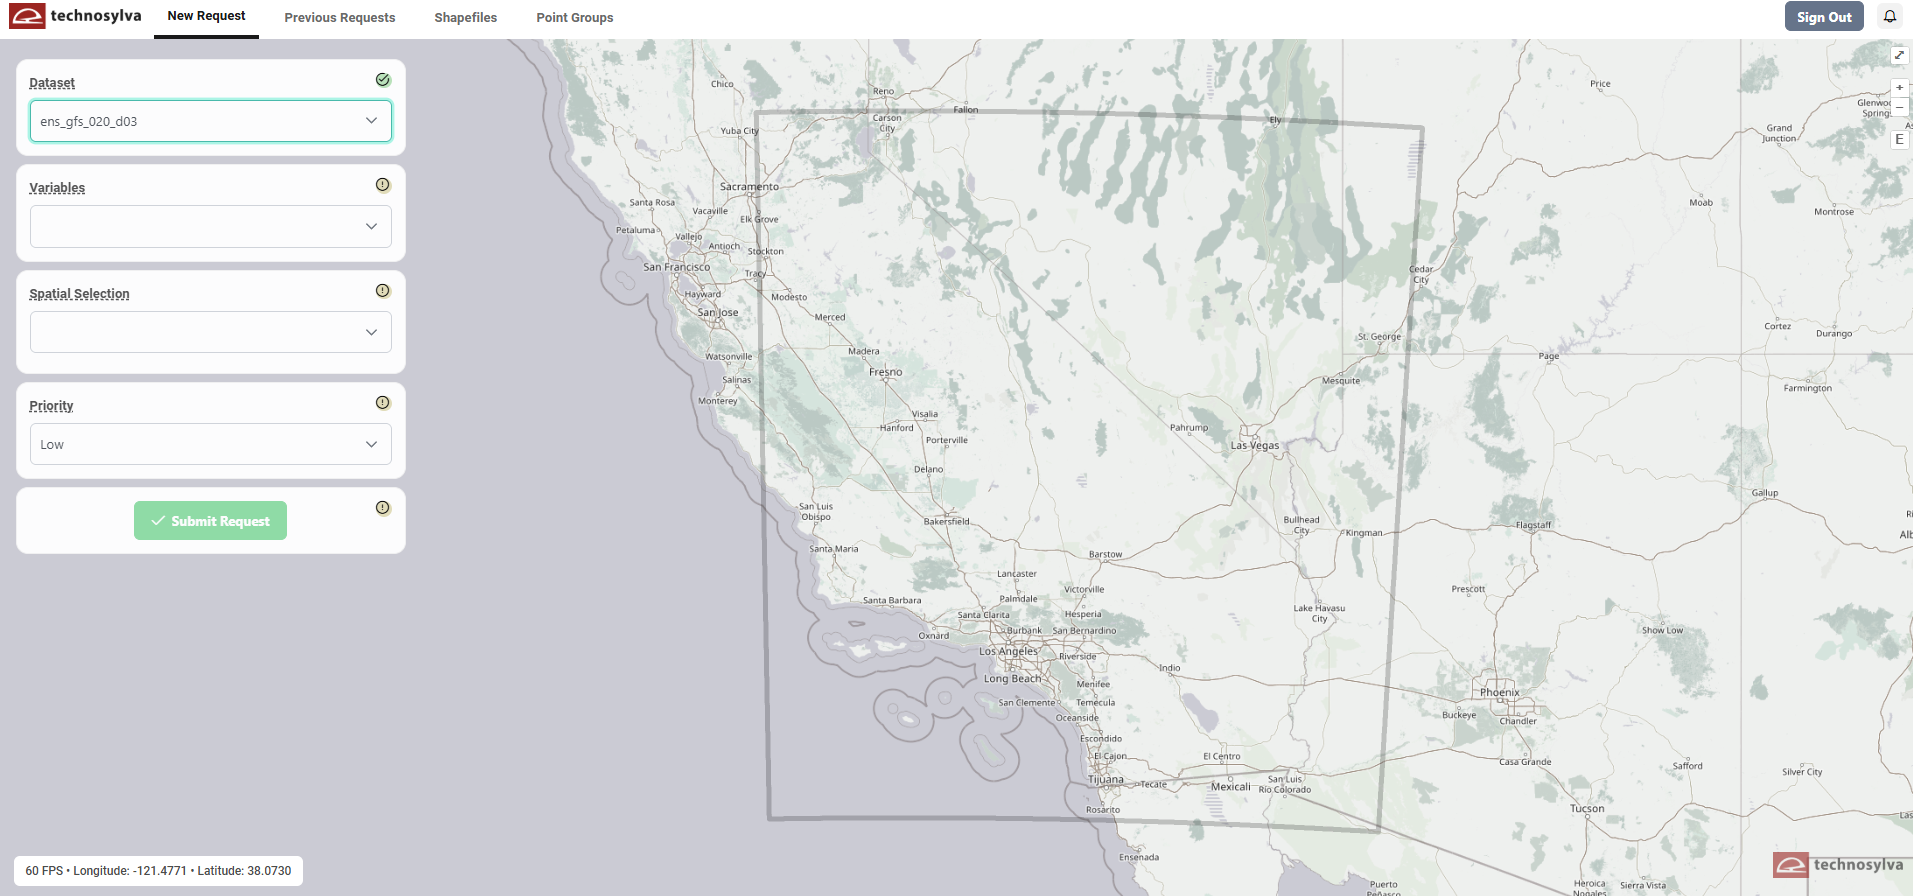
For this example, we will use ens_gfs_020_d03. This dataset covers the region where the Palisades fire occurred, includes data through January 2025, and contains the wind gust variable we need.
Step 2: Upload Your Shapefile
Before selecting a region, you need to upload your service territory shapefile. Click the Shapefiles tab in the top navigation.
Find the dataset you selected in Step 1 — in this case ens_gfs_020_d03 — and click Add Shapefile beneath it. The Ingest a New Shapefile dialog will open.
Click Choose and select your shapefile. You can upload a ZIP archive or select multiple individual shapefile component files. You can also drag and drop files directly into the upload area.
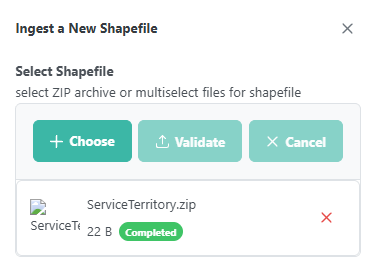
Click Validate to check the file. If validation passes, the shapefile will be ingested and will appear in the list under the dataset.
Click the New Request tab to begin your query.
Step 3: Select the Dataset
Choose ens_gfs_020_d03 from the Dataset dropdown. Once selected, the map zooms to show the dataset's geographic domain.
Step 4: Select Variables
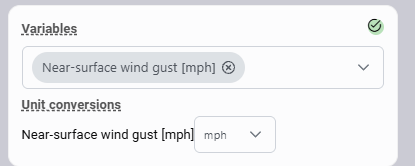
Open the Variables dropdown. Type "wind gust" in the search bar, then select Near Surface Wind Gusts and set the units to mph.
Step 5: Define Your Area of Interest
Open the Spatial Selection dropdown and select Shapefiles. Choose the shapefile you just uploaded. The selected area will highlight on the map.
Do not select a Spatial Aggregation.
Step 6: Set Temporal Parameters
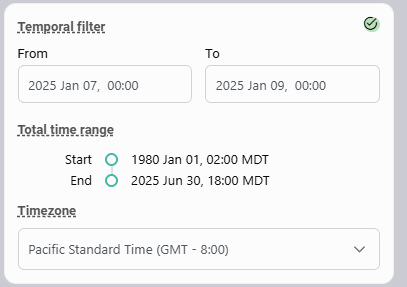
Open the Temporal Parameters dropdown and select Hourly Time Series.
Set the following:
-
Start date: 2025-01-07 00:00
-
End date: 2025-01-09 00:00
-
Timezone: PST
This gives us two full days of hourly wind gust values, starting just before the fire was first reported, localized to Pacific Standard Time.
Step 7: Set Output Format
Leave Computation Order as-is.
Select KMZ as the output format. This allows you to open the results directly in Google Earth and step through the data hour by hour on the map.
If you prefer to work with the data in a spreadsheet or analysis tool, select CSV instead.
Step 8: Give Your Request a Name
In the Request Description field, call your request “Palisades Hourly Surface Wind Gust Tutorial” or any name you prefer.
Step 9: Set Priority and Submit
Leave Priority at Low (the default).
Click Submit Request. If any field shows a yellow warning indicator, return to that field and address the issue before submitting.
Step 10: Check Your Results
Click the Previous Requests tab. Your query will appear at the top of the list with a status of Running or Completed. Small queries typically complete within a few minutes.
Once the status shows Completed, click the Download button to save the result file.
Step 11: View the Results
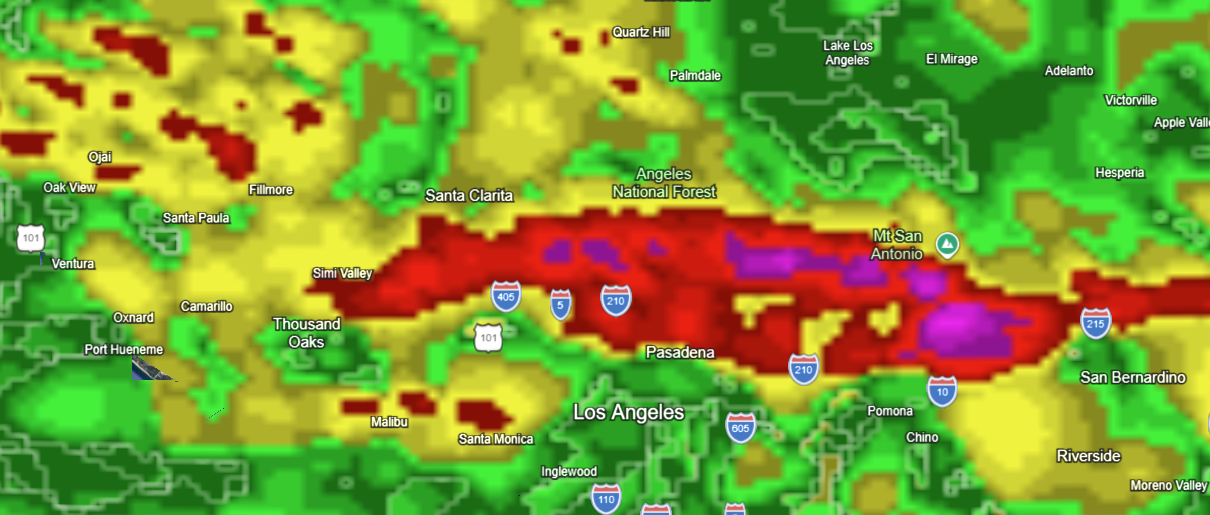
Open the downloaded KMZ file in Google Earth. Use the time slider to step through each hour and observe how wind gusts changed across your service territory over the two-day period.
For CSV results, open the file in your preferred analysis tool. Each row corresponds to a grid cell and timestep within your selected region.